Some time ago a prospect called me to ask if I could help him solve a really frustrating problem. He had some software that was working and that he had delivered to dozens of clients, but sometimes it froze. It featured a lot of timers and he thought the problem was that one of them stopped firing, but he wasn't really sure. Could I do a code review for him and find where he had been stupid or sloppy to cause this problem?
So this is an intriguing concurrency problem, because multiple overlapping timers are not something you can definitively test, so I answered him "sure, send me the code." He sent it along and unfortunately it was really quite well written. That's unfortunate because I couldn't point to some obviously sloppy or stupid code and say "fix this and all will be well." We gave him some advice about how to gather problem information from users when they reported that one of the clock/timers "froze", and wished him luck.
Months later he came back, saying that it was a distinguishable subset of his clients that were having the problem, and please could we look again? He sent us the source code, as well as a deploy package that had gone to the most recent client to experience the problem. At first, we couldn't build his source code, because he had a whole pile of custom controls and funny license files and so on. So while we were waiting for him to send us things, we played with the executable. We couldn't make it misbehave. If repro cases don't come easily I usually switch to reading the code and imagining what could cause what I'm seeing, but when that doesn't work I'm back to trying for a repro. We were hoping it was having some sort of leak - memory, handles, something like that - which was freezing or hanging it. Repeated perusals of the source code convinced us the timers were a red herring, leaving mystery leaks as our best guess.
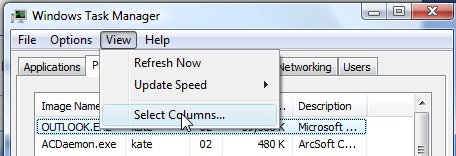
Did you know you can get Task Manager to show you more than just memory and CPU usage for your applications? On the View menu, choose Select Columns:
Then check off what you want, such as Handles and GDI Objects. Now watch while the application runs:
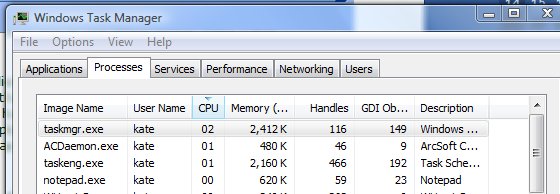
In this case, the deployed application didn't have a memory or handle leak, but it did seem to have a GDI Objects leak. The count kept going up, and never went down. We even discovered a way to make it go up -- there were buttons in the UI forming a toolbar of sorts, and they had a special effect as you moused over them and moused off again. Every time we caused the special effect to fire, the GDI Objects count would go up. This is the sort of thing that's impossible for developers to repro, because we don't idly wave our mouse back and forth along a toolbar wondering which button we should click. We test for like 5 minutes and say "looks ok to me." But we had been told that the freezes generally only happened when the application ran longer than usual - 4 hours rather than the usual 2 or 3. So we were hoping for some sort of leak that generally had no consequence, but could kill you if you waited long enough. So having learned how to drive the count up, we sat there waving the mouse around and driving it up. When we drove it past 10,000 - the application froze. Yay! Repro!
So we went into the source to reproduce it under the debugger - but the version we built from the source he sent didn't show the same behaviour - the GDI Objects count was well behaved and went up and down a little bit, never getting anywhere near 1,000 never mind 10,000. And interestingly, the source code he had sent us just used regular buttons in that toolbar like area. Aha! I blame the special button.
I asked him, since I didn't have the source for the version that was freezing, to tell me more about the button and where it came from. He told me the name and the URL from which it was downloaded. I went there and got a version number and file name, and confirmed he was running the most recent version available from that site. He also told me that now that I mentioned it, the only folks who'd reported freezing were the folks for whom he'd included the special button. So I knew it had to be the culprit. Time for some searching. Several people claimed that control had a "memory leak" problem. What's more, the developer of the control had released a newer version, which hadn't been mirrored over to the URL our guy found it from.
I told him all this, he went and got the newest version of the control, built the solution, and indeed the GDI count is now well behaved, and no-one has been able to make the application crash, freeze, or hang ever since. (I sat on this story for a few months to be sure.) So there you go, problem solved! I wouldn't have thought it was possible when we started. The moral for me is to use all the tools you have, and to use them fully. This problem was solved with Task Manager, an insistence on trying to reproduce the problem, and Live Search. Phew!
Kate