 Tuesday, 11 July 2006
So if you want your app to behave well on Vista and have no clue where to start, here's a helpful post from Jeremy Mazner that links to a number of screencasts to get you started. How to tell Vista you need admin privs. How not to need admin privs so much. How to use the power APIs (that's volts and amperes power, not only for smart developers power). How to hook into Vista search.
Download them, watch them, make better Vista apps.
Kate
 Monday, 10 July 2006
Jesper Johansson is a world-reknowned security guy. His talks are always highly rated and people love to hear him tell them how to be safer than they are now. So when he says "please don't turn off UAC", will you listen?
Yes, it's annoying to be constantly authorizing things, especially when you just clicked the button to do whatever it is that needs to be authorized. Some of that is an artifact: it shows up far more often in the early days of a new install because you're busy configuring and administering the system. Some of that is because permission sets may still need tweaking. Changing the time zone was moved into "doesn't need admin privs" while changing the time was not, for example, and there may be actions that are triggering a UAC prompt that shouldn't be. This is what betas are all about, testing developer choices against the behaviour of real users.
The other reason for a lot of UAC prompting is apps that demand privs they shouldn't need, because their developers can't be bothered to use per-user stores, for example. If that's your app, and you're testing it on Vista, you need to change it so it works well on Vista. Not leave it as is so it works fine on Vista-with-UAC-turned-off. That's just "it works on my machine", and my developers aren't allowed to say that. 
Kate
 Sunday, 09 July 2006
Long long ago, I posted a neat drag and drop trick. Here's another. I regularly find myself in a Windows Explorer window, looking at the files it contains, and wanting a command prompt so I can type some command or another. Today it was regsvr32, but it varies. So what I usually do is open a command prompt, Alt-Tab to the explorer window, highlight the path, Ctrl-C, Alt-Tab back to the command prompt, and then leap through all the command prompt nonsense to paste. Bleah.
Here's something quicker. In the command prompt, type "cd ". Then with your mouse click on the symbol before the path in the explorer window:
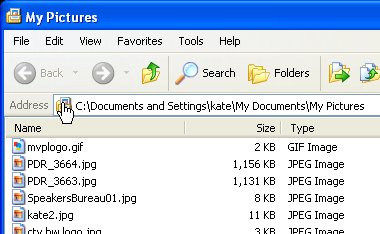
Drag it into the command prompt and let go. Nice.
Kate
 Saturday, 08 July 2006
Conditional breakpoints are cool when you know the value of one variable that is associated with trouble: this only blows up when Xid is 1234. They can also be used to reduce the boredom of single stepping. Say you've got some loop that goes around a few hundred times building up some string or array or something. You don't want to keep going round and round and round... it would be nice to jump ahead to halfway through, for example, and see how things are looking. Now if this is a for loop with a handy named variable, say
for (int i = 0; i<1000; i++)
Then you can use a conditional breakpoint and say "stop when i is 200". Or you could be clever and stop when i % 200 is 0 -- so that's every 200 times. But what if there's no i? What if you're going through a file or a recordset/dataset/resultset and you're going until the end? You don't want to add some fake variable that gets incremented each time through the loop, just so you can set a breakpoint that breaks on certain values of that variable. Instead you want to use the hit count property of the breakpoint. Just right click the red dot and choose Hit Count. There you can set the breakpoint to break whenever it's hit, just the 10th time it's hit, every tenth time (10, 20, 30 etc) or every time after the 10th time Or, of course, whatever number you want instead of 10:
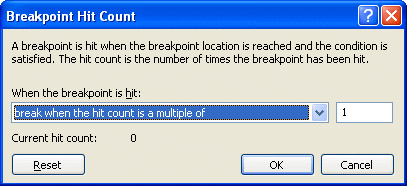
Don't debug the slow way when there are tools to make you so much faster!
Kate
 Friday, 07 July 2006
Conditional breakpoints were another really important tool in solving a recent "only happens at the big installations" bug in a big and complicated C++ application. We wanted to debug the code with as few rebuilds as possible and we really didn't know how parts of it worked at all. Tracepoints helped us to figure out a lot of it in a short time. We didn't have a decent repro case though, so here's what we did:
- created a script to add an audit table and some triggers that write to it
- created a script to remove those triggers and the table
- created a batch file to run a server in verbose mode, and redirect the output to a text file (remembering DOS commands sure can be helpful... myapp.exe -verbose >logfile.txt was the magic phrase.)
- wrote some instructions for the support guy to grab a backup of the database, run the first script, run the batch file, let it run all night, then in the morning grab another backup of the database, run the second script, and stop the batch file.
Now we ran some queries on the morning version of the database to confirm that at least one X was missing a Y that should have been calculated overnight. We even had the Xid. Thanks to the tracepoint work of the previous day we knew where to be suspicious. A little digging in the trigger output told us whether the problem was "didn't get added" or "got added, but then got deleted". The last step was conditional breakpoints. These let us say "only stop here when you're processing the X with this Xid."
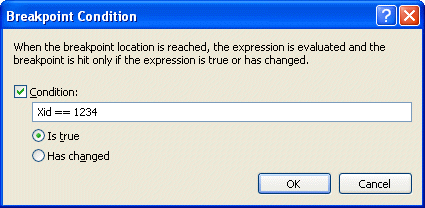
This really saves time when you just need to drill into what's happening in the case that is going wrong. You get to it by right clicking the red dot or diamond and choosing Condition.
Kate
 Thursday, 06 July 2006
The mentoring client I helped solve a big hairy bug using tracepoints does work in C# as well. She asked if tracepoints are available in C# and VB.NET too. They sure are!
As well, you can get to them other ways than just right clicking the red dot. There's a breakpoints window (reach it from the Debug menu: Debug, Windows, Breakpoints) that shows you what is set up for each of your breakpoints and tracepoints, and which you can use to enable, disable, delete, and edit breakpoints. You can also double-click a line in this window to go to that line of source:

I like to add that "Language" column when I'm working on a mixed project. Just click the Columns button and make your choices.
Kate
 Wednesday, 05 July 2006
When you have a "mystery" bug to solve, tracepoints are a vital part of your debugging arsenal. Single stepping and looking through code can be S-L-O-O-O-O-W and if you don't even know what you're looking for, it can consume hours and hours of effort. Tracepoints really speed things up. They're like breakpoints that don't break. In a way, they go back to the old "printf debugging" -- but you don't need to make code changes and recompile to change them.
To set a tracepoint, first set a breakpoint, then right-click on the red dot that appears in the margin and choose When Hit:
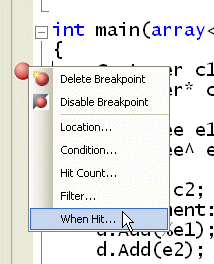
In the dialog that appears, click the Print A Message box and edit the starter message you are given. You can include any expression in braces and it will be evaluated when control reaches the tracepoint:
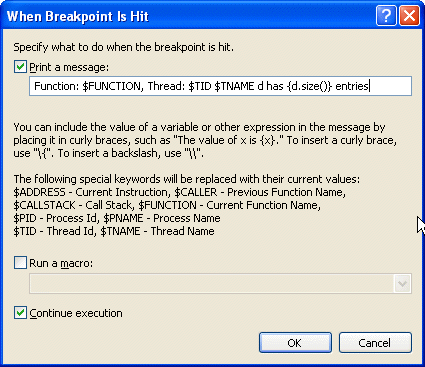
Leave the Continue Execution box checked so that you don't break. Tracepoints are identified by red diamonds instead of red dots:
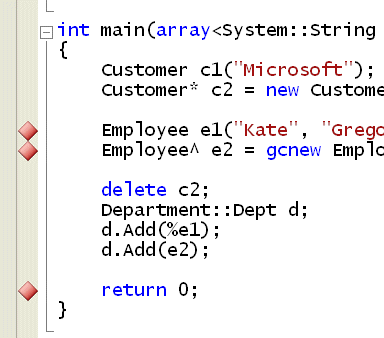
The output from the tracepoints appears in the output window of your debug session:

You can set up something suspicious, let it run, then pore through the tracepoint output and see what you learn. It's a huge timesaver when you're tackling a "we don't even know where to start" bug. Plus, if the issue is related to threading or async issues in any way (and you know me, I keep preaching we will all be facing async issues eventually) then you don't have to worry that pausing execution suppresses the collisions. I recently helped a client solve a big hairy this-stuff-fails-for-our-biggest-customer-only bug using tracepoints... and a few other tricks I will cover in upcoming posts.
Try it!
 Tuesday, 04 July 2006
Is a blog just for reading? Some blogs have way more life in the comments than the original posts (think Mini Microsoft for example, and I'm not saying the original posts are lifeless, just that the comments really take it up a notch) while others (like the one you're reading now) have very few comments. I like to think that people wander off and think about what they read, or go fix the problem in their code (hello all you broke-your-sql-reporting-services-installation people, I see your search terms in my activity list) and think nicely of me.
But here's a rather interesting blog entry. It's one word long. And that word is not all that unusual. Now I love self-reference, Godel, Escher, Bach etc, so I laughed. And I'm not alone. The commenters got it right away, drawing on a long tradition back to Usenet (at least 20 years) and then bringing in some more recent traditions. Good fun for as long as you can stand it.
Kate
 Monday, 03 July 2006
From the "did you know" department: Aero is (sort of) AERO because it actually stands for "Authentic, Energetic, Reflective and Open".
These are words that can be interpreted however you like. Does authentic mean "not fake" or does it mean "true to the thoughts the user has about how to interact with the OS?" How can a UI be energetic? Does that just mean lots of bright colours, glowing jelly buttons, and animations? What does the UI reflect? And open to what?
I will say this though, they are all positive and pleasant words, and if a team held those words up as goals while working on software for me, I would expect that they would make me pleasant software. In a UI, that's a good thing.
Kate
© Copyright 2026 Kate Gregory
Theme design by Bryan Bell
newtelligence dasBlog 2.3.9074.18820   | Page rendered at Tuesday, 14 April 2026 22:10:51 (Eastern Daylight Time, UTC-04:00)
|
On this page....
Pluralsight Free Trial
Search
Navigation
Categories
Blogroll
Sign In
|