Searched for : debug
Lately a lot of people have been asking me for help as they write C++ code. I’m usually happy and able to help. There are times, though, when I either cannot help, or choose not to help. I thought it might be helpful to explain some of these a little. It’s quite likely that other members of the community have a similar set of guidelines in their heads for when they do and don’t help people with code. Warning: this is long. I think it's worth reading it all. You want a TL;DR? It’s this: if you want free mentoring and consulting from successful people, you can have it! All you need to do is ask. But if you expect your helpers to do most of the work in helping you, and to take instruction and direction from you, you’re going to get a lot less help than if you know how to be helped effectively. The first choice is where and how you ask. People often email me, message me on LinkedIn, DM me on Twitter, DM me on the #include <C++> Discord, and so on hoping to get personalized, instant, one-on-one help from me. That’s not a good use of my time. I prefer to help in places where others will see the question and the answer. That helps more people. It also enables more people to help – so it produces better advice as well as helping those people learn and grow. Often, I learn from the times when other people chime in. So I encourage you to post on StackOverflow (if you have the sort of just-one-question, just-one-right-answer problem that fits there), or on the #include <C++> Discord, or some other public place where a number of people can see the question and the answer over time. The rest of the issues have to do with how much work the person expects me to do, or how much they save me. Think about how you ask the very first thing you ask. Compare “here is a zip of all the files in my project can you tell me what’s wrong with it?” to “here is a link to an online compiler (Godbolt, wandbox, etc) showing a compiler error on line 43 that I don’t understand. Can you tell me how to fix that error?” Expecting someone to install things, trawl through multiple files, guess your question, and then solve your problem and explain it all to you is really too much. At least tell people what your problem is! Often people ask for help saying something like “it’s not working” or “what’s wrong with this?” and I don’t even know if it’s a compiler error or a runtime error or running fine but calculating the wrong answer. So before you post on the discord, for example, try to have a single crisp question, not just “help, it’s not working.” - Show us your code, and your errors. And not as screenshots! You can copy the code into an online compiler like Godbolt or Wandbox, or if it’s less than 20 lines or so, paste it into the chat window – but please learn how to format it as code when you do that. Copy and paste the errors as text. That makes them much easier to read, and lets us copy and paste parts of them while explaining things to you. If you can’t show your real code because of how big it is or because it’s work-related, create a tiny example that shows the same problem and show us that. Stack Overflow has some tips on how to do that. Whatever you do, do not free-type some code into the chat window that you think is the same as your problem, and then whenever people point out missing semi colons or undeclared variables, reply “oh yeah, that’s not really my code it’s just something I typed to give you the general idea.” Compilers (and runtimes) are picky and asking for help with something that’s vaguely like your real code (but not really) is pointless.
Now let’s assume you manage to get a conversation going with someone who is trying to help you. They solved that compiler error, for example, but now you have another one. As part of this process, I often make suggestions to people that they reject. I think they believe the suggestions are to make things easier for themselves in the long run, because they say things like “I can do that once it’s working.” I then have to spend a lot of effort explaining that I want them to do these things so that I can help them get it working. These suggestions include: - Write good variable (and function) names. If your variables are all called i, n, c, r, s, and so on – I don’t know what they represent. If I ask you to change those to words like next, rate, total, and so on, or to words you think of yourself, that’s because I can’t understand your code (I don’t know the problem you’re trying to solve) without some help. Good names aren’t a someday thing that you paint over working code once it’s all good. They are how you make code other people can read. And you’re asking me to read this code. Make it readable.
- Use a debugger. When I ask “have you looked in the debugger to see the value of a before the loop?” an answer of “I don’t know how to use the debugger and I don’t have time to learn that today” is a great way to end our conversation. Real programmers use the debugger. We don’t have some magical compiler-simulator in our heads that can read code and tell you if it compiles or not, and we don’t have a magical runtime-simulator either. Sure, maybe I can tell at a glance that a is 0 before the loop and that’s why it’s not working, but in that case I would tell you so. It’s more likely that I want you to quickly check and see if it’s 0 or not. When you refuse to debug, you’re making it so much harder to help you. You need to learn to use whatever debugger is available to you, and you will probably save enough time today to make up for the time it takes to learn it.
- Add some tests. You don’t have to go learn a whole unit testing framework. But if you’re writing a function to do whatever, work out by hand what it does for simple values, and write a test harness that passes it those simple values. Then you can debug the test harness and see what the function returns and confirm whether or not it works for simple values. Whether you’re reversing a string in place, calculating the Fibonacci sequence, calculating sums of things, whatever, you should be able to think up simple test cases and test your code with them. And eventually, you should be writing tests as you write your code. It’s a good habit you can build now.
- Break up big things. You don’t have to embrace full OO or write functional programs, but don’t give me 1000 lines of code and ask me to load it into my head. Write some functions. Heck, throw in some comments and some blank lines. Show the structure of your code so it’s not a wall of text.
Some other good behaviours that will take you a long way: - Try the substitutions people tell you to try. A lot of times, people who are having a hard time don’t want to learn a new thing. I run into that situation all the time myself. I’m already frustrated and I’ve spent longer than I meant to and I can’t understand any of it, I don’t want you to tell me to go learn yet another thing right now. I have gained some wisdom over the years though, and it includes this: sometimes jettisoning all that half-understood not-really-working mess and doing something simpler is the best way forward. If someone tells you that vector would be better here, and offers you a few lines of code to use, just digging in your heels and refusing to try it isn’t going to lead you into learning. If you’ve got a problem because you’re trying to manage memory yourself by hand but you forgot about copying and so on, then using a smart pointer, or dropping the pointers altogether and using an object on the stack, is going to make a whole pile of work just fall away. The person advising you to try this knows how much effort it will save. You don’t, that’s why you came for help. It’s really frustrating to see a beginner insist on doing something the hard way (for no benefit), do it wrong, and refuse to accept any help other than “here is the precise and exact code to do that thing the hard way.” I don’t want to do things the hard way any more: why would I type out all the code for you?
- Try things that don’t matter to you, if the person who is helping you tells you that your code is harder to read the way you have it. Things like initializing member variables in a constructor with the : syntax, not between the braces, or adding some using statements – these may not matter to you, but making things too hard for a busy helper may mean that helper is too busy to help today. Or ever. I don’t want to teach you bad habits, I don’t want to teach you to “pretty things up” only once it’s working, and I don’t want to exhaust myself reading difficult code to spare you the trouble of doing the right thing. Also, when a person asks for advice but never takes any of it because they’re sure it’s not actually relevant to their problem, eventually the advice-giver will stop giving it. It’s pointless.
- Write your own code. If I tell you “the problem is that you’re not initializing x” don’t ask me to edit your code for you or paste in the new version of the function or whatever. You need to understand what you’re doing and that comes from writing the code yourself. If you don’t understand how to fix a problem that someone has told you about, ask them “how do I fix that?” If you can’t understand their answer, say “I don’t know what [whatever] is, can you explain it or show me?” Don’t just ask “what would that line of code look like?” That feels like you’re asking me to even do the typing for you.
- Work with whoever is talking to you. Maybe when you first ask, one person has a couple of thoughts, and those are good, but while you’re changing your code to see if that works, someone else chimes in. That’s great. It’s a group chat. Don’t tell them that you’re working with the first person or anything like that to reject their help. Consider all the suggestions you get. If you’re talking to someone and then they stop, that’s cool too. Many people pop into chat for 5 or 10 minutes waiting for a conference call to start, or while they’re eating lunch, and don’t stay long. People get called away from their keyboards. Don’t start pinging the person trying to bring them back or ask if they have any more thoughts or saying you’re still stuck. You can tell the room or channel as a whole that you’re still stuck. Maybe someone else will have some ideas. Your problem may end up solved over an hour or so with three different people. That’s a win!
I know, that’s a lot of advice. Thing is, you can get a lot of help from strangers on the internet, if you ask the right way. If you ask the wrong way, most people will just shrug and say “looks like you have a problem” and move along. They won’t even tell you why they’re not helping you! To get the marvelous free help, and to truly join the community, you have to put in a little effort. Trust me, it’s worth it! Kate
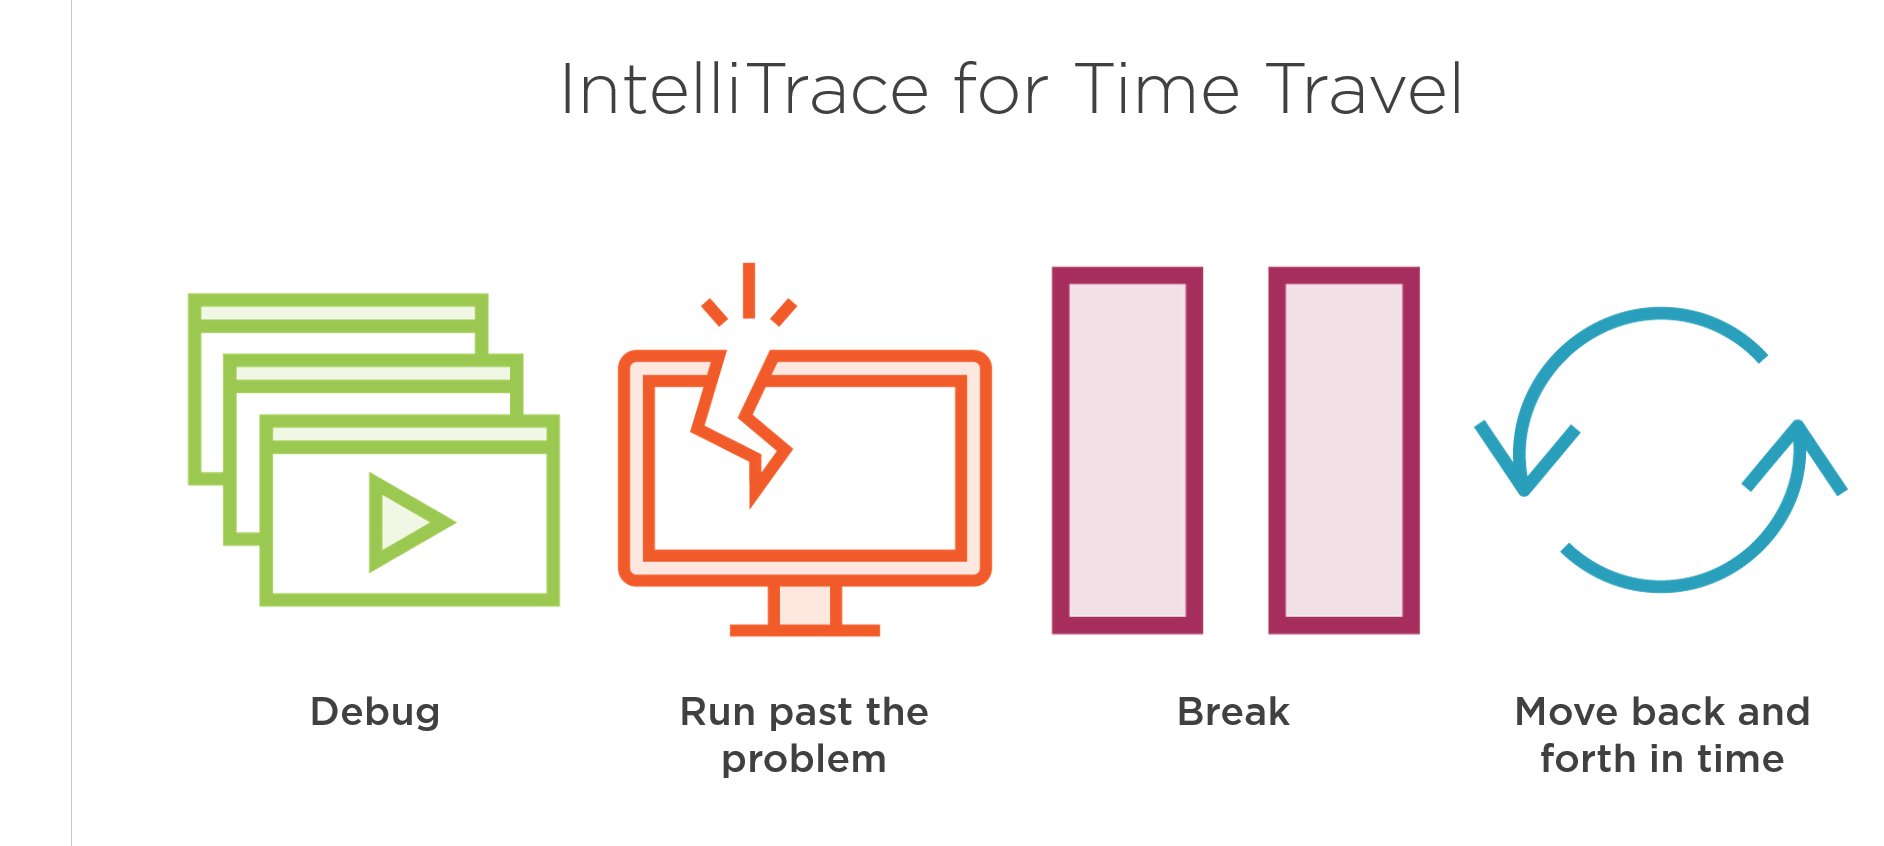
I just published a small course on Pluralsight called Advanced Debugging with Visual Studio 2019. It covers IntelliTrace and Code Map, two features that are only in the Enterprise Edition of Visual Studio. Many people don't know about them, so I put together a quick introduction.
Here are some of my other current courses:
- Visual Studio 2019 Getting Started - what you need as a new user of Visual Studio to start using it. There are a variety of other Visual Studio courses, and pretty much all of the material from my 2017 one is still applicable, so don't take just this one or you'll be missing some really powerful techniques.
- Beautiful C++: Updating Legacy Code - I really enjoyed writing this course and if you maintain old C++ code, I think it will make your life a lot easier. It discusses both specific patterns to update (and why) and overall strategic approaches (not mechanically replacing every incidence of one pattern with a newer pattern.)
- C++ Fundamentals Including C++ 17 - this is the go-to course for developers who want to learn C++ today. Whether you never did any, or did some a decade or two ago, this course will cover the syntax, library, and best practices you need. If you've never programmed in any language, try Learn How to Program with C++ instead.
- Using Stack Overflow and Other Stack Exchange Sites - we all go to Stack Overflow when we're stuck. But a lot of us are bad at it, because it doesn't work like other sites. Take a little time to improve this skill and you'll get better and faster answers. You might even become one of those high-rep users who others admire!
- Beautiful C++: STL Algorithms - Stop writing raw loops and you will get more readable code with less effort. The library has so much waiting for you and this course will help you make sense of it all.
There are more, but if you take all of these, you'll be in a strong place as a C++ developer. (BTW, only the Visual Studio courses require Visual Studio. All the others work with any development environment you prefer.)
Kate
I spent much of the spring working on this course, and am delighted to see it live!
Visual Studio 2017: Essentials to the Power User is 7 hours of good stuff you need if you're a Visual Studio user. My emphasis is on keeping you happy and productive by getting the tool to help you and showing you neat features you probably didn't know about. If you open that link in a new tab, you can play the course overview (a 2 minute "trailer") and look at the table of contents. I've done versions of this course for older Visual Studios and I get comments like "It's as though I have a whole new IDE" and "I've been using Visual Studio for years and you showed me things I didn't know, and I'm glad I do now."
I think debugging in general is not taught enough, so I'm happy to have 2 whole modules on it here - not on philosophy of debugging or how to narrow down a bug, but just on how to operate the machinery of Visual Studio's debugger. There's lots of it. Plus, if you have Ultimate, there's another half a module on "Historical Debugging", IntelliTrace. I also spend quite a lot of time on how to find your way around a large codebase with the various searching, finding, navigating and exploring capabilities that have evolved over time. Here's a quick topic summary: 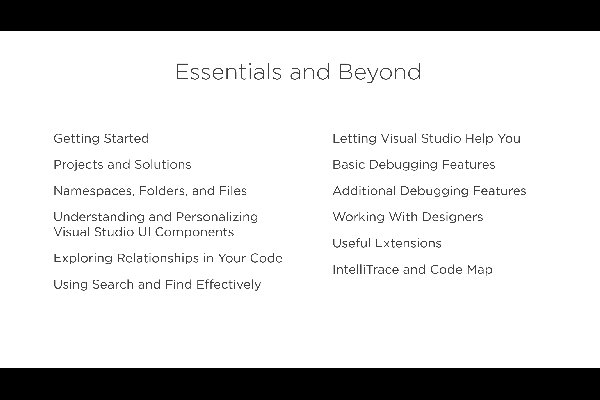
I really enjoyed writing this course and hope you enjoy watching it. If you need a free trial, look over to the right on this page for the grey rectangle that says Author and click for a 10 day trial. Kate
Our
longest-serving employee, Joyce MacDonald, has worked her last day with us.
She’s moving away to the other side of the country, where I don’t doubt another
firm will soon find themselves blessed with her skills. Joyce joined us full
time 16 years (and one month) ago, and had been working part time for us long
before that. From the very beginning, every task that she took on she
transformed and improved. We needed data entry when we were building a website
for a local real estate firm; she took the procedure for adding a listing and
kept streamlining it – open these three files at once, copy this once, then
paste it here, here, and here – until she had cut the target time in half and
then in half again. Later, she helped to develop our Quality Procedures and to
bring order to chaos in our software development process as we moved to agile
and changed our client mix. She helped our developers to become more organized,
to report progress more thoroughly, and to test before committing or deploying.
She trained our clients to think about what they really needed and to consider
the consequences of what they were asking for. I have never met anyone who
cared as much about the success of the firm as Joyce. We’ve employed dozens of
people who’ve done good work, worked hard, and cared about our clients. The
majority of them, like the majority of people everywhere, never gave much
thought to whether the company was doing well, except perhaps to wonder or
worry if their job was safe, or if there would be money to spend on perks. I’m
not complaining; I think that’s perfectly normal. Joyce is wired differently:
it’s fundamentally important to her that things are done right, that the client
gets what they want, and that the company makes a profit. That’s what just has
to happen, and it’s generally what she’s able to make happen.
Joyce
started doing data entry and office administration but quickly moved into more
complicated tasks. She’s been managing projects and client interactions for a
long time. She also made sure that people did what they were supposed to do
when they were supposed to do it, and kept everyone informed and contented. If
you’ve ever called our office, you’ve probably talked to her. She’s probably
reassured you about something and made sure it got taken care of for you. She
has her PMP now, which formally recognizes how well she manages projects, gets
requirements out of customers and organized in a way we can all understand, and
builds appropriate processes for developers to follow. She’s taken on the challenge
of managing not just seasoned, well-behaved, adult developers, but also
students and our own grown children, who are not always easy to control. Let’s
just say they meet their deadlines for her  . .
Losing
Joyce to the west coast hasn’t been a total surprise for us. When we came back
from the epic Pacific trip, she got the opportunity to move and though she
delayed it, we rather knew it was inevitable. Over the past 6 months or so
we’ve adjusted the balance of work we take on so that our remaining clients
will be those I can handle client support for, and whose projects I can manage.
(Brian will continue to be an architect, developer, and star debugger who
doesn’t have to talk to the clients.) For our clients, nothing much will
change. For us, there will be a hole in our lives – personally and
professionally – that will take a while to settle down. When she joined us,
Joyce was a neighbor (I believe we first met in the summer of 92), and for a
long time she walked or rode her bike to work in the office attached to our
house. Our kids have grown up together. When stuff happens, Joyce is the one we
talk it through with – business and not-business. We were able to go to the
other side of the world for five weeks, often with no internet, knowing the
company would tick along fine without us. It’s going to be an adjustment not
having her with us every day, not having her to count on. Still, we know why
she’s moving, and we wish her all the best in this new phase of her life.
Kate
PS: If
you’ve found this entry as part of due diligence in a hiring process, let me be
clear: Hire Her. You won’t regret it.
The first keynote at CppCon this year was Bjarne Stroustrup (who invented the C++ language) announcing the C++ Core Guidelines. They are on Github and once he announced them, as Herb Sutter reported in the second keynote the very next day, they quickly became a trending topic across all languages. Here is a description of the guidelines from there: The C++ Core Guidelines are a collaborative effort led by Bjarne Stroustrup, much like the C++ language itself. They are the result of many person-years of discussion and design across a number of organizations. Their design encourages general applicability and broad adoption but they can be freely copied and modified to meet your organization's needs.
The aim of the guidelines is to help people to use modern C++ effectively. By "modern C++" we mean C++11 and C++14 (and soon C++17). In other words, what would you like your code to look like in 5 years' time, given that you can start now? In 10 years' time?
The guidelines are focused on relatively higher-level issues, such as interfaces, resource management, memory management, and concurrency. Such rules affect application architecture and library design. Following the rules will lead to code that is statically type safe, has no resource leaks, and catches many more programming logic errors than is common in code today. And it will run fast - you can afford to do things right.
To me, these guidelines are the key to getting across my fundamental message that C++ does not have to be hard, scary, complicated, or dangerous. The language may still say “it’s your foot!” but the guidelines, and the tools they can drive, are quite the opposite. You probably know that Visual Studio has a static analyser built in. (You should, anyway, I’ve blogged about it.) It will catch things like this: int* p = nullptr;
*p = 10; But it doesn’t mind things like this: int arr[10];
int* p2 = arr; Two lines, two violations of the guidelines – I’m not initializing any of the elements of arr, and then I am using its address as a regular old pointer. Now, there’s nothing wrong with regular old pointers – some people have got quite a hate on for them with the rise of genuinely smart pointers, but pointers are fine. Using pointers to control lifetime isn’t fine, because it’s impossibly difficult. But pointers themselves are fine. What’s not fine here is the “decay” of an array into a pointer – folks from other languages don’t expect that at all, and some marvelous bugs have hidden behind this simple bit of helpfulness from the compiler. So there’s a guideline that says don’t do that. Specifically:
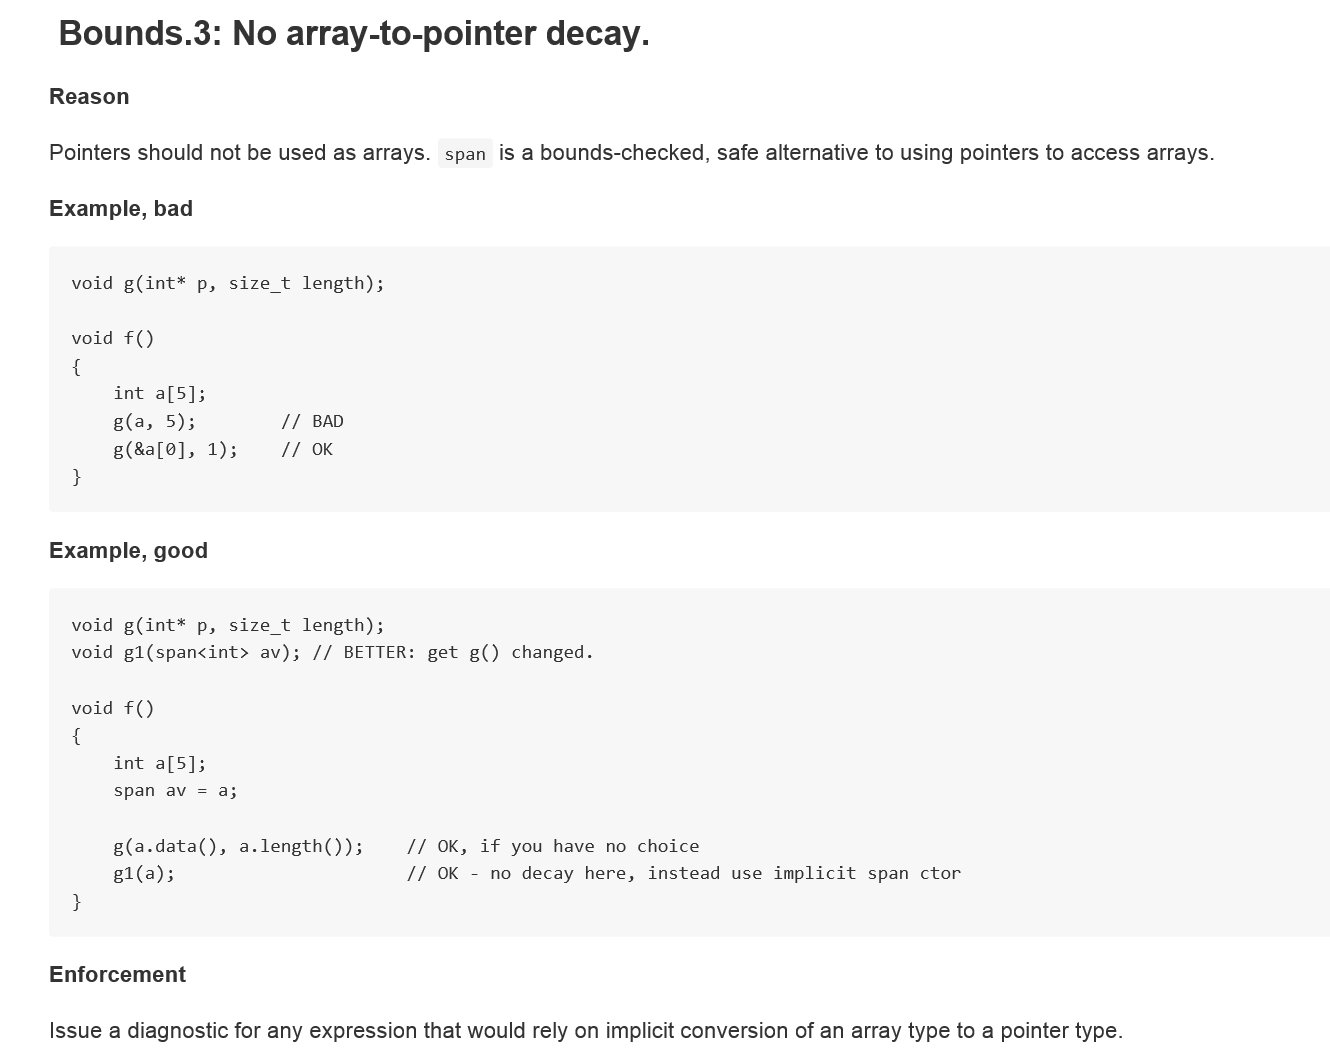 (I’m giving you a picture of code because if you want to copy and paste you should go to the live, always updated, guidelines on github.) This guideline is part of a “profile” – a particular set of rules that are designed to be enforced and that are supported by tools. Well, when I say tools I might be overstating the case a little. There’s just one tool at the moment, but that could be enough! This tool, C++ Core Checker, is on the NuGet Gallery. You don’t have to get it from there though. You get it, and use it, from inside Visual Studio 2015. Any version will do. If you don’t use Visual Studio normally, just get and install the Community Edition, which is free and is ok to use for commercial purposes, from https://www.visualstudio.com/ . (Need the fine print? if you’re using it as a person, you can do whatever you like. If you work for a company with less than 250 PCs and less than a million dollars US in revenue, again you and up to 4 of your coworkers can use it for whatever you like. If you work for an “enterprise” company then any and all of the employees can still use it for learning purposes or to work on open source.) Note that Visual C++ isn’t part of the Typical install, so you’ll need to choose Custom and select Visual C++: 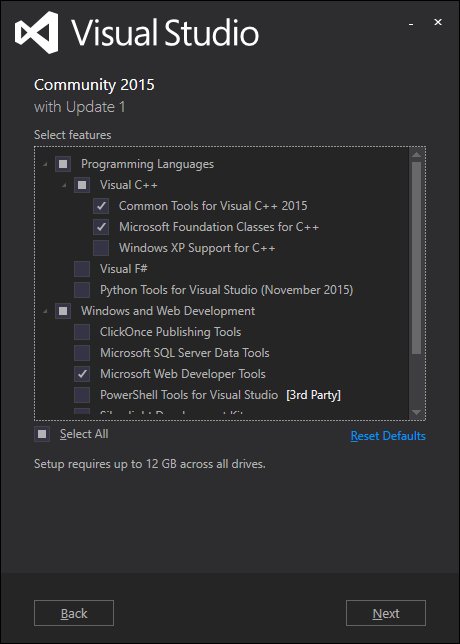
So once you have Community Edition or some edition of Visual Studio, make a console application and put in the two bad lines of code. Build it and then also run static analysis on it (On the Analyze menu, choose Run Code Analysis, On Solution.) You won’t get any warnings or errors. That’s your pre-guidelines life. You’re doing something inappropriate and nobody is telling you. Now, add the checker to your solution. This is solution-by-solution, not a change to how Visual Studio does static analysis. On the Tools menu, choose NuGet Package Manager, Package Manager Console. In the console window that appears, type Install-Package Microsoft.CppCoreCheck and press enter. You will see output like this: Attempting to gather dependencies information for package 'Microsoft.CppCoreCheck.14.0.23107.2' with respect to project 'ConsoleApplication1', targeting 'native,Version=v0.0'
Attempting to resolve dependencies for package 'Microsoft.CppCoreCheck.14.0.23107.2' with DependencyBehavior 'Lowest'
Resolving actions to install package 'Microsoft.CppCoreCheck.14.0.23107.2'
Resolved actions to install package 'Microsoft.CppCoreCheck.14.0.23107.2'
Adding package 'Microsoft.Gsl.0.0.1' to folder 'c:\users\kate\documents\visual studio 2015\Projects\ConsoleApplication1\packages'
Added package 'Microsoft.Gsl.0.0.1' to folder 'c:\users\kate\documents\visual studio 2015\Projects\ConsoleApplication1\packages'
Added package 'Microsoft.Gsl.0.0.1' to 'packages.config'
Successfully installed 'Microsoft.Gsl 0.0.1' to ConsoleApplication1
Adding package 'Microsoft.CppCoreCheck.14.0.23107.2' to folder 'c:\users\kate\documents\visual studio 2015\Projects\ConsoleApplication1\packages'
Added package 'Microsoft.CppCoreCheck.14.0.23107.2' to folder 'c:\users\kate\documents\visual studio 2015\Projects\ConsoleApplication1\packages'
Added package 'Microsoft.CppCoreCheck.14.0.23107.2' to 'packages.config'
Successfully installed 'Microsoft.CppCoreCheck 14.0.23107.2' to ConsoleApplication1
PM>
This changes your project settings so that analysis runs this Core Checker for you. Repeat the analysis step and this time the new tool will run and you will get output like this:
------ Rebuild All started: Project: ConsoleApplication1, Configuration: Debug Win32 ------
stdafx.cpp
ConsoleApplication1.cpp
ConsoleApplication1.vcxproj -> c:\users\kate\documents\visual studio 2015\Projects\ConsoleApplication1\Debug\ConsoleApplication1.exe
c:\users\kate\documents\visual studio 2015\projects\consoleapplication1\consoleapplication1\consoleapplication1.cpp(9): warning C26494: Variable 'arr' is uninitialized. Always initialize an object. (type.5: http://go.microsoft.com/fwlink/p/?LinkID=620421)
c:\users\kate\documents\visual studio 2015\projects\consoleapplication1\consoleapplication1\consoleapplication1.cpp(10): warning C26485: Expression 'arr': No array to pointer decay. (bounds.3: http://go.microsoft.com/fwlink/p/?LinkID=620415)
========== Rebuild All: 1 succeeded, 0 failed, 0 skipped ========== Where it says "type.5" and there's a link, that's to the specific rule in the "type" profile that this code breaks. And where it says "bounds.3", the same - I showed a picture of bounds.3 up above.
Isn’t that great? Come on, it’s great! The tool will add more rules as we move through 2016. I’m going to have a lot more to say about the Guidelines as well. But this is a great place to start.Why not point it at some of your own code and see what happens?
Kate
I have a new Pluralsight course on Visual Studio called Visual Studio 2015: Essentials to the Power-User. It starts at the beginning, so if you're new to Visual Studio it will help you get started, but carries on "to 11" as it were, covering things many everyday users of Visual Studio don't know. Here are the modules, each with their length: - Getting Started (42:08)
- Projects and Solutions (13:23)
- Namespaces, Folders, and Files(27:03)
- Understanding and Personalizing Visual Studio UI Components (26:57)
- Exploring Relationships in Your Code(36:41)
- Using Search and Find Effectively(28:15)
- Letting Visual Studio Help You (46:28)
- Basic Debugging Features (24:04)
- Additional Debugging Features (44:30)
- Working with Designers (39:37)
- Useful Extensions (39:54)
- IntelliTrace and Code Map (25:57)
If you don't have a Pluralsight subscription, click the Author link over on the right hand side of this blog - click Subscribe, then Start 10-Day trial. That should give you a good idea of how valuable the subscriptions can be. (My company buys subscriptions for my staff, and I use my free author one all the time. It's a great way to learn a new technology.) My main goal in this course was to have Visual Studio make sense to the learner. There are so many ways to do any action that sometimes when you learn something it seems pointless, and you quickly get tired of learning an endless parade of similar features. I worked hard to put these into an order that would lead naturally through the capabilities of the tool, and put things in context. If you watch all 12 modules, you'll know more Visual Studio than most developers - and you'll have a productivity boost to show for it that should be pretty impressive! Please do give it a try. Kate
It's just around the corner - the largest C++ conference EVER with over one hundred talks! 
And two of those talks I'll be doing with James McNellis. We had such a good time presenting together for Microsoft Virtual Academy that we decided to do it again. How do these sound? Modernizing Legacy C++ Code
C++ is a programming language with a long, storied history spanning over three decades--four if one includes its C ancestry. The C++ language has undergone many changes during that time, compiler technology has advanced substantially, and computers today are very different from the computers of decades past. But despite all of these advances, there's an awful lot of C++ code in use today that looks like it was written in the 1980s. In some cases, the code was written in the 1980s and it's still in use; in other cases, it's recently-written code that just doesn't use modern style.
In this talk, we'll discuss some of the problems with legacy code, and review some practical techniques for applying principles of modern C++ to gradually improve the quality of legacy code and improve maintainability and debuggability. We'll show how some very small changes to code can yield huge benefits.
Making C++ Code Beautiful
Ask a non-C++ developer what they think of C++ and they'll give the language plenty of compliments: powerful, fast, flexible, and "the language for smart people". But along with that you are likely to hear ugly, complicated, hard to read, and "the language for smart people". Is it possible to write beautiful C++? Not arcanely elegant or wickedly compact, but readable, clear, expressive - beautiful! We say it is, and we want to show you how.
In this session, you'll see how to turn pages of "comic book characters swearing" into code you'll be proud to call your own. By making your code express your intent, using the power of new language and library functionality, and leaving hard-to-read constructs out of your vocabulary, you can give your code a makeover that will stand the test of time.
If you're not registered yet, there's still time! All five days cost $995 and there are one and two day passes available for less. You're going to want to meet and learn from the stars of C++ - check the full session list to read all about it. Kate
My latest Pluralsight course, Introduction to Visual Studio 2013 - Part 2 is live and ready for action. The modules are:
- Basic Debugging
- Additional Debugging Features
- IntelliTrace
- Working With Designers
- Extensions
If you haven't watched Part 1, you really should.

What's my next course? I'm trying to decide that at the moment and will let you know when it's underway.
Kate
I've been busy this fall with the release of Visual Studio 2013. One of the things I've been working on is live now: a new Pluralsight course. I focused on new things that matter to C++ developers, whether that's compiler support for language changes (hello, variadic templates!) or IDE changes that were implemented for C++ as well as "the other languages". Here's the description: The C++ Language and the Standard Library both changed dramatically with the release of C++ 11. Some of these features were not implemented until Visual Studio 2013, and those are presented in this course. You'll learn about variadic templates, improvements in constructing and initializing variables, and rawnstring literals. In addition a number of productivity boosting enhancements in debugging, editing, and using libraries are in this version and you will learn how to take advantage of them.
If you don't have a Pluralsight subscription already, there's a free trial available, so please check it out! Kate
If you know someone who wants to get started using C++, and has done at least a tiny speck of programming in other languages (so I don't have to explain what a loop is) then you might want to point them at this free online event:
C++: A General Purpose Language and Library
Attention developers: here’s a painless way to learn the basics of C++ from the ground up, whether you’re updating legacy code or writing brand new, efficient, and high-performance code for new platforms like phones and want to take advantage of C++. You’ll learn the fundamentals of the C++ language, how to use the language and its Standard Library effectively, and how to use the Visual Studio environment for developing C++, including debugging, exploring code, and understanding error messages. This is your starting point for building software in C++.
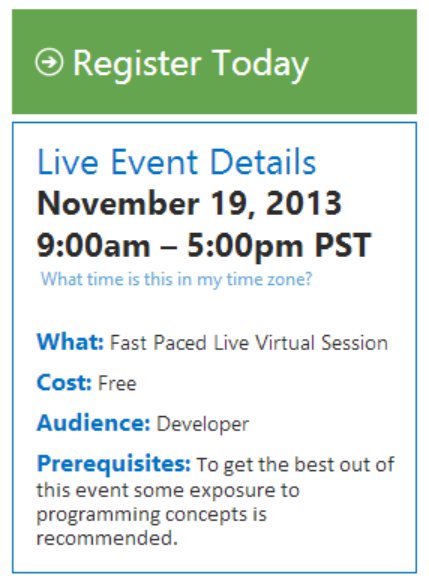
James McNellis (of the Visual C++ team) and I will spend the day walking through the fundamentals of the language and the Standard Library. We're going to have a great time. Please send us some beginners to keep us company!
Kate
The week of April 8th, I'll be in Bristol, UK, attending ACCU. I'm looking forward to it tremendously - there is a great lineup of sessions and I only wish I could have spared the time to stay on for the C++ committee meetings that will follow it. I am, however, making the most of my time in that delightful city. Having enjoyed Guy Smith-Ferrier's presentations in several different locations, including my own East Of Toronto .NET User Group, I can now turn the tables and present at his. Of course I want to do a C++ talk. But it's not a C++ group. So to be fair, I've decided to do two talks: First, Use All of Visual Studio to Become a Better Developer
Most developers know how to use Visual Studio to do the basics of being a developer. You can create a solution, add projects to it, edit code, and run it. Easy, right? In this session, I want to show you how to be a better developer by using parts of Visual Studio you might not know about. Save hours of debugging time, move around your code more smoothly and don't lose your place, see what you want to see and find what you need to find. Demos will be in C# with Visual Studio 2012.
Second, C++ in 2013 – Why on earth?
There are so many languages a developer could use today. Yet some developers still use C++. Some developers are learning C++ when they already know C# and other younger languages. This session will show you why that is happening, and why you might want to learn the new C++ yourself. It's nothing like the C++ you remember, and it can be a very useful language for you to know.
Please do register for these, and I hope to see you there! Kate
I love writing courses for Pluralsight. I can reach a lot of people and I know the production quality will be top notch. My most recent course is Introduction to Visual Studio 2012 Part 1. It's aimed at people who've never used Visual Studio before, but even a seasoned user will learn something from it - just use the cool speedup feature to zip through things that are already familiar, like the difference between a project and a solution. I cover some very nice productivity features and there's sure to be something in there that's new to you. Another recent Pluralsight development is that the MSDN Subscriber benefit has expanded to cover MSDN subscribers worldwide, not just in the US, and five more courses were added. If you have an MSDN subscription, you can watch all these courses free: - Agile Team Practices with Scrum
- ALM for Developers with Visual Studio 2012
- ALM with Team Foundation Server 2010
- ALM with TFS 2012 Fundamentals
- Building Windows 8 Metro Apps with C# and XAML
- Building Windows 8 Metro Apps with C++ and XAML
- C# Fundamentals - Part 1
- C++ Fundamentals
- Continuous Integration
- Developing for Windows 7
- IntelliTrace
- Introduction to .NET Debugging using Visual Studio 2010
- Introduction to Building Windows 8 Applications
- Introduction to Visual Studio 2010 - Part 1
- Introduction to Visual Studio 2010 - Part 2
- Introduction to Visual Studio 2012 - Part 1
- Introduction to Windows 7 Development
- Kanban Fundamentals
- Microsoft Fakes Fundamentals
- Solution Modeling with UML in Visual Studio 2010
- Test First Development - Part 1
- Test First Development - Part 2
- Web Application Performance and Scalability Testing
- Windows Azure Diagnostics
- Windows Phone 7 Basics
The bolded ones are mine. Here's how to sign up - do it by Dec 11th 2012 - and get your one year free access to all these great courses!
Kate
Oh my goodness. What a week that was! Here's how I thought I would do my first summary. Links to videos, discussions of sessions I either went to or tried to go to (more on that in a moment) along with my tweets from the ground, as it were. My first real tweet Tuesday morning (8:37 California time) was announcing that my PluralSight C++ Fundamentals course had gone live. Then the keynote started. Here are my tweets and retweets along with the time into the keynote I said them: - 6 minutes: #bldwin totally dominating my stream SS doing a good intro to lean back computing
- 37 minutes: RT @dseven WinRT API'S are natively built into Windows and built to reflect in different languages - C/C++ and .NET. #bldwin
- 42 minutes: Starting at 8PM today, Seattle time, you can download all of the code that attendees at BUILD received. t.co/nuTuwga
- 43 minutes: RT @wkrwk Did anyone notice the UI during the VSE 11 demo is the classic Windows UI? #bldwin
- 48 minutes: #bldwin VS vNext demo is breaking twitter = no hope of following it all
- 50 minutes: RT @andrewbrust Expression Blend is still Grey on Black. It could use a little "fast and fluid," frankly. #bldwin
- 51 minutes: Store menu in VS?? #bldwin #wholenewworld
- 58 minutes: RT @rhundhausen Desktop (#x86) apps can be listed in the #windows8 store as well #bldwin
- 61 minutes: RT @ayus :))) RT @timheuer The Red Shirt is dominant even when not present. #bldwin @scottgu
- 79 minutes, @EdgarSanchez retweeted @rickasaurus asking "I'm interested in hearing more about this new GPU offloading API. Any links? #bldwin" and I answered "Check my blog as the week goes on for GPU stuff"
- 80 minutes: RT @marypcbuk Sinofsky: that gaming PC looks like ice. Angiulo: more like lava, it converts 700w of power to 4.7 teraflops like 3,500 Cray XMPs #bldwinPlatform for Metro style apps
- 87 minutes: RT @Pete_Brown Dude just cracked open a laptop on stage and showed the electronics. Can't beat that #bldwin #geek
- 100 minutes: RT @andrewbrust When will we admit Sinofsky's doing a great job? He's working hard, not just presiding. #bldwin
- 120 minutes: RT @ronnipedersen If you have an iPad, don't watch the build keynote… It'll make you feel like you have bought a C64 #bldwin
- 127 minutes: RT @jonbrasted It is a great day to be a Windows developer. #bldwin #trbbuild
The download surprised me, I didn't think it would be ready for people to try on any old hardware. And the hardware demo was very very good. And sure, I was on instant messenger back to the office saying "it's official" when the rumour was finally confirmed that we were getting tablets. But mostly, I really liked what I saw and wanted to know more, which is what keynotes are all about. After eating something completely unmemorable, I found my way to the overflow room, always a little more casual and a good place to find "the cool kids". I had already met a number of old friends in the huge keynote session and before it, but here were more. I'll just give you the links to the Big Picture sessions. They are all very good. - 8 traits of great Metro style apps - a truly excellent session by a presenter who cares deeply about the topic. I tweeted a lot less during this one because it required more active listening.
- Platform for Metro style apps - another very good session during which I just retweeted some other people's "Hey, this stuff is C++" reactions and a link to the session planner app for the phone, which I used heavily.
By this time people were starting to "get it" (including me) and the excitement level was rising. Here's just what I retweeted: - @coridrew #bldWin is really, really, really making me want to //BUILD/ Windows apps #BestConferenceNameEver #WhoKnew
- @briannoyes Add ref from js project to C++ library - really empasizes this is running native #bldwin
- +@fignewtron iPad limited in many ways to consumption - Windows 8 is production and consumption on many devices. Sales numbers decide winner. #bldwin
- @mcakins Wow, the silence from Apple's camp is deafening! Windows rocks once more! Its 1995 all over again! #bldwin
One more session: Tools for building Metro style apps - I was getting tired at this point. It was a lot to take in. People were lined up the length of the convention centre for tablets. I knew there were enough for all of us, so I went back to my room to edit my pointers module for the PluralSight course so it could "tack on" to the end of the published course. While videos rendered, I had a little back and forth on Twitter with people who had noticed how much fun I was having, and others who were playing with their tablets already. I slipped out to pickup the tablet about 7:30 but didn't open it till the module was done. Then: - 10:48 pm: got major piece of work done ... yielding to temptation ... tablet here i come #bldwin
- 10:57 pm: How's that for fast setup? Everything's installed.... Trying visual studio next
- 11:11 pm: Just wrote a Win8 C++ app on the tablet with touch keyboard. Built and ran first time. #winning
That's right, I didn't even set up the bluetooth keyboard. People cite Visual Studio as an app you couldn't possibly use with touch. I wouldn't want to do it all day, but I did it! Then I played a bit more. Day 2 started with another whole keynote. C++ was front and centre here. Some tweets: - 17 minutes: RT @seesharp 3D graphics debugging at the pixel level in DirectX. Unreal. #bldwin
- 33 minutes: RT @bgervin killer strategy for MS to help developers make HTML apps for iOS and Android #bldwin
- 34 minutes: RT @tpdorsey RT @EisenbergEffect […] in C++, you can write your own WinRT library, which when built, can be used by C++, C#, VB and JS.
- 34 minutes: RT @jmorrill This new COM and C++ version is not _anything_ like what you think it is. From what I can tell so far...effing amazing!!!!
- 49 minutes: Loved it RT @MichaelDesmond Zander shows off the new image editor in VS11 as he works on a C++ DirectX game.
- 54 minutes: RT @shycohen Moving a VHD while the machine is running is cool. Moving a live VHD is even cooler! :) Will enable amazing things in the future. #bldwin
- 82 minutes: most tattoos ever in an MS keynote
- 95 minutes: RT @seesharp WOAH. Did not expect Steve Ballmer today. Everyone was starting to leave already. Woah! #bldwin
- 97 minutes: RT @carafone 500,000 downloads of #win8 already! #bldwin
- 98 minutes: RT @LACanuck And #Win8 was downloaded 500K times in 12 hrs RT @mashable: RIM Has Sold Just 490,000 PlayBooks - on.mash.to/nEu0dU #bldwin
- 102 minutes: That's what these keynotes were missing! Turns out it's a great time to be a developer. I was worrying, no-one had told me yet #bldwin
- 105 minutes: I've been paid to program since 1979. Keynotes tell me at least once a year it's a great time to be a developer. And they're right. #bldwin
Then it was time for simultaneous breakouts, and that meant choices. You can search the sessions list as well as I can. The C++ ones are not to be missed. These are happy people who are delighted to tell us what's been going on, and they're proud of it, too. At 3:13 I tweeted " Went quiet because i am massively engaged with C++ content in packed rooms. Small break between sessions to say "wow!" #bldwin #happycamper". The remainder of the afternoon was super confusing. People were jumping to conclusions, correcting each other, having opinions about the death of this that and the other. Because C++/Cx (the language extension you use to call WinRT) looks a lot like C++/CLI, people thought it was managed, but it's not, it's all native code and C++ Metro apps get a perf boost from that. The understanding that something amazing and powerful still has COM at the core began to grow. People were reporting trying to use Windows 8 gestures on their iPads and on nontouch screens, showing that the team has made some very intuitive choices. One tweet of mine I want to repeat: " Big props to Aleš Holeček for joining in the Q&A in the last C++ talk of the day when the questions got really Windows-y. Impressed. #bldwin". Even if you're not a C++ developer, download that session and watch the Q & A. Day 3 started with being turned away from a C++ session, and so going to a different C++ session that was on at the same time. Several people from the C++ team made the trip with me, giving me a chance to tell them how impressive all this was. Meanwhile on mailing lists, people who weren't onsite and were 12 - 24 hours behind as they waited for session videos to go live were echoing the confusion and dismay of yesterday. It was hard to be patient with them. It's going to make sense, I wanted to tell them. Just hang in there! I took a small break from sessions to watch (and help with) the C++ part of Channel 9 Live (I am still waiting for links to the recording, because I couldn't hear everything they said and I want to) and then to Herb's second talk - again the room jammed full and dozens turned away, Don Box (who had earlier reminded us COM is still love) blurting out his admiration for Herb as a speaker and the great content, and the terrific line, " We protect against Murphy, not Machiavelli". What a time to be a C++ developer! Day 4 kicked off with kind words from Daniel and a chance to hand out paper copies of the whitepaper I recently blogged. I got some quiet time with various smart people who told me their thoughts on all this. I'm still synthesizing it all. I also was downloading videos like a mad thing. I came home with 22 hours of video to watch and since then have grabbed another 15 or so. Some people began to realize they had over-reacted. Some excellent blogs began to appear - Doug Seven, for example, had several sensible things to say. And then it was time to go. Glenn Ferrie tweeted " Writing C++ in the airport #bldwin #WinRT" and that summed up the week for me. I have a lot of watching, coding, thinking, reading and talking to do so I can establish what all this means. But hey, why not join me? It's a great time to be a developer! Kate
Word is starting to get out about C++ AMP, which appeared out of nowhere at a conference remarkably few Microsoft developers were paying attention to, because it was a hardware conference. There was information available in June, enough to get some of us excited: I got into this right away and have been playing with code and doing a little writing. This is the kind of technology that changes things more than you might think. By leveraging the GPU, your code might run 10x faster, 50x faster, or even 100x faster. And for you to be able to do that from C++, using familiar C++ constructs, and a debugger and profiler in Visual Studio? That means everyone can do it. Well, not quite everyone. You do have to learn how to parallelize your algorithms. The syntax of using the GPU (or some other heterogeneous computing resource) is not hard at all. The computer science of knowing your work is data parallel can be hard. But let me show you "not hard". Consider this code to add a pair of one-dimensional array: void AddArrays(int n, int* pA, int* pB, int* pC)
{
for (int i=0; i<n; i++)
{
pC[i] = pA[i] + pB[i];
}
}
Compare that to this: #include <amp.h>
using namespace concurrency;
void AddArrays(int n, int * pA, int * pB, int * pC)
{
array_view<int,1> a(n, pA);
array_view<int,1> b(n, pB);
array_view<int,1> c(n, pC);
parallel_for_each(
c.grid,
[=](index<1> idx) restrict(direct3d)
{
c[idx] = a[idx] + b[idx];
}
);
}
It's all C++ and it's all pretty readable. And this code runs on the GPU and can be WAY faster (and use less power, meaning your data centre is cheaper or your battery lasts longer) just like that. Recently Daniel Moth has published ten blog posts drilling into some details. They will help if you've decided to start using AMP and want to know how. But before you do that, you might like to read a little background on why heterogeneous computing matters, what other options you might have for doing it, and why C++ AMP is what you want to use. I've done a small whitepaper on just that and would love you to read it and let me know what you think. Kate
Everyone knows that C++ is the language to use when speed matters. That's just a known fact. So here's a question: if you solved the same problem in both C++ and C#, using the generally available languages (the Standard Library for C++, the .NET Base Class Libraries for C#) and you didn't happen to know which parts of those libraries weren't implemented very efficiently, just wrote your apps -- which would come out faster and by how much? Think you know? Of course, the answer is "it depends". Debug or Release builds? Laptop or handheld device? Whose implementation of the .NET Framework are you going to use - Microsoft or Mono? What chip are you running on? Oh, and to what extent are you deliberately setting C++ options that emphasize runtime speed? Also, did you choose an algorithm with a lot of generics or templates? C++ has a huge perf advantage there, but lots of benchmarks don't use generics or templates since they are solving one specific problem. An article on CodeProject leapt into all of this feet-first and did some measuring. Along the way, "Qwertie" proved a universal rule of the internet: nothing will get you the answers you seek faster than posting the wrong answer. Want to know the exact date Bewitched switched Darrens? Find a place that discusses old TV shows and post your belief that there was only one, or that there were seven, or whatever, and people will correct you while the ads are still loading on their copies of the page. When Qwertie posted the first version of the benchmarking article, commenters were quick to say "but you made this mistake, and that mistake, and forgot this other thing" all of which led to a much better article. Definitely worth a read. It gets you thinking about the things that truly affect performance. Absent-mindedly deploying a Debug build is going to cost you far more performance than your language choice ever will. Using a library in a performance-sensitive situation without understanding whether the library is high-performing or not will too. It's chock full of graphs like this one: 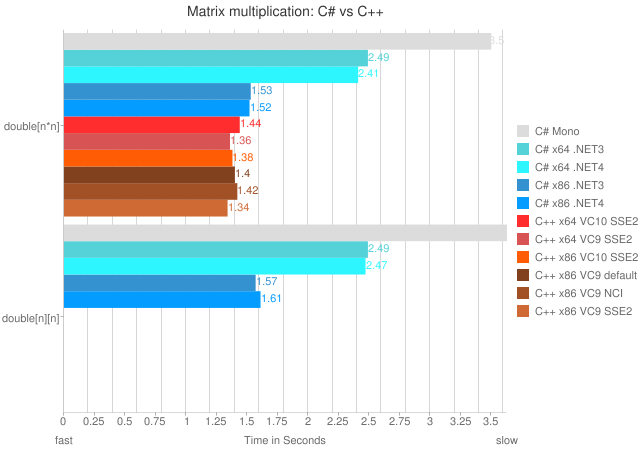 Don't read it to find out the answer to "is C++ faster than C#?" - we already know that. Read it to find out how to make your applications faster. Kate
I consider myself a pretty skilled debugger, and reasonably familiar with the things you can do in Visual Studio (My Visual Studio course Part 1 and Part 2, for example.) Conditional breakpoints, tracepoints in C++ and in C#, breakpoints that only break every 10th time they're reached, customizing the data tip that shows when hovering over one of your own types, making data tips transparent, and plenty more have all been covered here in the blog over the years. But I still come across things I didn't know before, or didn't try before. Take this blog post by "Daan-Nijs" about the abilities of the watch window. I knew the first one, but the rest are new to me: - Changing a value in the watch window
- Changing a type in the watch window
- Inspecting an array in the watch window
Then there's re-running or skipping code by dragging the instruction pointer - I only knew I could right click somewhere and say Set Next Instruction. Finally he includes a reminder of how to enable Edit and Continue. All this is for C++, but you're welcome to give some of the techniques a try in other languages and see what happens. Being a faster and more productive debugger will rocket you up the overall productivity leagues like nothing else. Kate
I have two sessions in Atlanta:
DEV303 | Modern Native C++
Development for Maximum Productivity
Breakout Session |
300 - Advanced | Developer Tools, Languages & Frameworks C++0x, the next C++ standard, is almost upon us and it contains the most important updates to the language since the mid-90s. These new features bring more expressiveness and power to the native C++ developer. Microsoft Visual Studio 2010 has added support for some of these key features in order to enable these modern programming techniques. This session clarifies what features are in Microsoft Visual C++ 2010 and what is yet to come. It illustrates how new constructs such as lambda expressions enable better use of existing libraries and how your code can be simpler, safer and faster all at the same time. Also, see how simple it can be to implement concurrency in your application and how Visual C++ 2010 supports the difficult task of debugging parallelized code. If you are itching to show off how C++ is one of the coolest languages on the planet, this talk is for you!
DEV304 | Advanced Programming
Patterns for Windows 7
Breakout Session |
300 - Advanced | Developer Tools, Languages & Frameworks Windows 7 development in managed code can be very simple, especially for those using the Windows API Code Pack. But there's more! Your integration with Windows 7 doesn't have to be limited to simple interactions with the new API. This session goes beyond the simple and into aspects of Windows 7 development that have in the past been left for you to explore on your own. See how to create a jumplist with a task that delivers a command to your application, as Messenger and Outlook do. Explore a simple and powerful recipe for connecting to Restart and Recovery with minimal effort. Discover how Trigger Started Services can reduce your power footprint while giving your users better responsiveness. Explore all that libraries have to offer beyond "File Open" and why using a library is a better approach than having a user setting for "save directory." I'm looking forward to it. If you haven't registered yet, you should! Kate
Despite this rather famous xkcd comic, most developers would rather spend as little time compiling as possible: 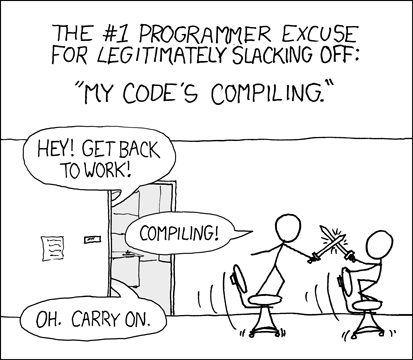
But most of us how no clue why a build takes as long as it does, or how to make a project build faster. I mean sure a Clean and then a Rebuild will take longer than an incremental build. But beyond that, which is quicker - a debug build or a release build? Debug puts more information in, but it doesn't optimize - which wins? Does it make a difference if you keep Visual Studio up all day or if you close and re-open it from time to time? Are there options you can set that make your builds faster? All this and more is covered in remarkable detail in a new blog post from the Visual C++ team. You need to read it.
Kate
One of the things C++ developers have had for ages is a way to see a function's return value in the debugger, even if it isn't kept in a local variable. For example, see tip 29 in this list of Visual C++ tips for VC++ 6.0 - a product released 12 or 13 years ago! Managed developers would like this ability, too. Jared Parsons, from Technical Strategy Incubation, points to a set of requests, and explains why it appears that VB has it already. (And you thought VB6 legacy support wasn't going to help you!) Take a look and see what you think. Would it be worth the possible performance hit? Kate
It's over 200 pages long, and over four years old, but I just heard about it recently. A long, dense discussion of whether certain C++ features (templates, namespaces, RTTI, etc) have a performance cost, and how to write code that incurs as little performance cost as possible. Its official name: ISO/IEC TR 18015:2006(E) Technical Report on C++ Performance. In addition to runtime performance, it also touches on compile slowness, the "brittle base class" problem, and the different performance characteristics of various STL collections and algorithms. If you care about the speed of your C++ code, you should read this, even if some of it is already familiar to you. I'd like to give some kind of "Restrained Understatement" award to this sentence: Template meta-programming and expression templates are not techniques for novice programmers, but an advanced practitioner can use them to good effect.
To be clear about where these authors are placing the "advanced" bar, I don't use meta-programming, I consider it too advanced for me. And I have 20+ years of C++! The whole report is platform independent (though embedded systems are discussed separately) and compiler independent, too. I wish it were updated for C++0x, but I guess that will have to wait until C++0x is settled . There's a 14 page bibliography, and you would do well to read many of them, though my source for the link winkily pointed out another possible paper. That one is old enough to get a driver's license, but I think you might enjoy reading it anyway. As the introduction begins: It is important to understand how your programming language is implemented. Such knowledge dispels the fear and wonder of “What on earth is the compiler doing here?”; imparts confidence to use the new features; and provides insight when debugging and learning other language features. It also gives a feel for the relative costs of different coding choices that is necessary to write the most efficient code day to day.
It's only 23 pages long, and concludes: ... we have considered many of the significant C++ run-time implementation issues. We see that some wonderful language features are almost free, and others can incur significant overhead. These implementation mechanisms are applied quietly for you, behind the curtains, so to speak, and it is often hard to tell what a piece of code costs when looking at it in isolation. The frugal coder is well advised to study the generated native code from time to time and question whether use of this or that particularly cool language feature is worth its overhead.
Good advice, in 1994 or 2010. Kate
Let's say you read the entry about data structure visualizers and in addition to all the STL humour you got excited about being able to control the way the debugger shows your objects as you work at understanding your application at runtime. And then you were sad because you don't do native C++ work and you don't know how you could get the same behaviour in a managed application. Well, have I got a keyword for you - DebuggerDisplay. Don't like that MSDN page about it? Here's another. Quick and easy, at least for simple types with only a few member variables. Give it a whirl. There's a nice example with screen shots at Dev102. Kate
Visual Studio 2010 has pretty cool Windows 7 integration. It gets jumplists right, for example: 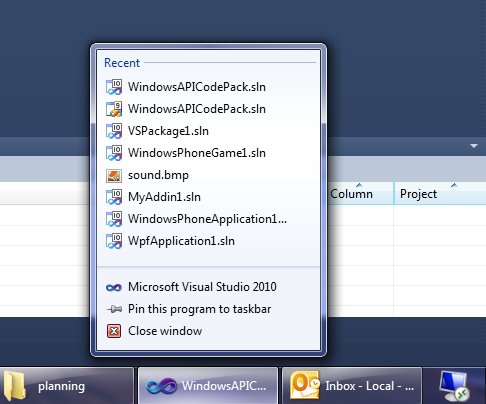
But it could do more, and this little add-in adds some fun extras. Here's a taskbar progress bar overlay during a build: 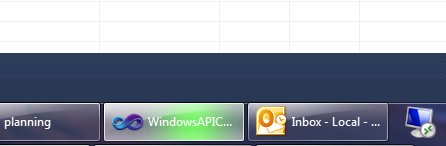
(If your build results in errors or warnings, you'll also get a taskbar icon overlay when it's done letting you know about them.) And here we have handy thumbnail buttons - for build, debug, and start without debugging: 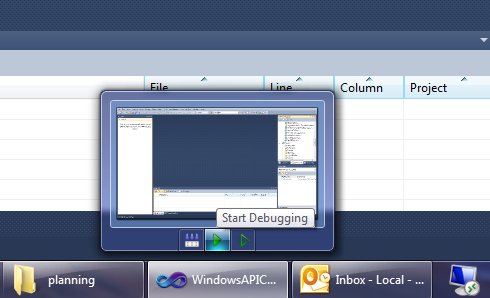
Give it a whirl! You can download it from the gallery, or use Tools, Extension Manager, Online Gallery right in Visual Studio and search for Taskbar.
Kate
If you use the Microsoft Visual C++ debugger, the team would like to hear from you. They have a quick (6 questions!) survey they would like you to take. Here's the survey, and the team's post about it, if you'd like to leave them a comment. Kate
Programming is not one skill - it's a large conglomeration of skills. Some people are not very good programmers because they aren't very good at imagining their way through an algorithm. Others have great ideas and imagination, but it's painful to watch them type and they can't be bothered to learn how to use their tools (editors, etc) so they just take twice as long as everyone else to create the code. Still others are doing fine until their code does something unexpected, and then things fall apart, because they can't figure out what's going on. They step too soon, spend ages stepping through code that couldn't possibly cause the problem, then get impatient and end up skipping right past the problem. Worse, they don't seem to understand the capabilities of the debugger. I've watched people spend over 5 minutes patiently stepping into so that when they reach a particular line, they know how control reached it. Then I show them the Call Stack window and they say "oh". I've blogged before about conditional breakpoints and tracepoints, hit counts, and so on. There is so much to the Visual Studio debugger that it is very hard to know it all. But the more you know, the better you are. And what's more, being a great debugger has more value than some of the other programming skills, because so much debugging happens at urgent times, is unexpected, and needs to be done as quickly and efficiently as possible. The difference in impact between being good and great is very large. So how to be a better debugger? Partly, it's practice, especially practice with someone who's really good. That person can say "hey, what are you doing? Here's a way easier way to get there!" Even practice alone can motivate you to learn how to do something and get you reading the documentation or searching the web. You could buy a book, if anyone even buys books any more. You could take a debugging course, and spend a day or a week with someone who really knows every speck of this enormous tool. Of course, that costs money, travel time, and so on. Some of you will do it, and benefit from it tremendously. But ALL of you can benefit from watching John Robbins' latest set of videos on Channel 9. It's in three parts and they total about three and a half hours. It hits the ground running and just doesn't stop. It's all using Visual Studio 2010 but the vast majority of the features he shows are in earlier versions too. I knew a lot of it (even the Go To Find box and the file opening etc) but I learned new things in the first ten minutes and continued to learn new things as they continued - both actual capabilities of the tool and interesting ways of thinking, like using hit counts on a breakpoint not to stop, but just to count how much some code gets run. I wish I could get the slides and code, but I guess some things need to be saved for the folks who actually take the course.
If you're a .NET developer, watch these videos. Now.
Kate
I like to introduce myself, in C++ circles, by mentioning I was using C++ before Microsoft had a C++ compiler. It's often interesting to watch people try to handle the concepts behind the sentence - mostly, that for some languages you can buy compilers from more than one vendor. And once upon a time, C++ existed as a language, and Microsoft sold compilers, but it didn't have a C++ one yet. Then eventually (OK, in 1992) the C product Microsoft sold became a C/C++ product (compiler, linker, debugger etc) and then the next year Visual Studio came along and with it Visual C++. And Visual C++ 1 included the Microsoft Foundation Classes 2, so that for a while the version numbers of Visual C++ and MFC were out of sync. Eventually there was a version skip to catch up (there was no Visual Studio 3). For quite a while we all worked with Visual C++ 1.52c and every speck of that version number was significant. So as you can see, the version of a product is not a simple question with one answer.
So, here we are, welcoming Visual Studio 2010. Lots of people called it Dev10 while it was under construction. But was the 10 short for 2010? It was not. It was just 10, as in the number after 9. Visual Studio 2008 was 9, and Visual Studio 2005 was 8. You can see these numbers on the shortcuts to your sln files, by the way: 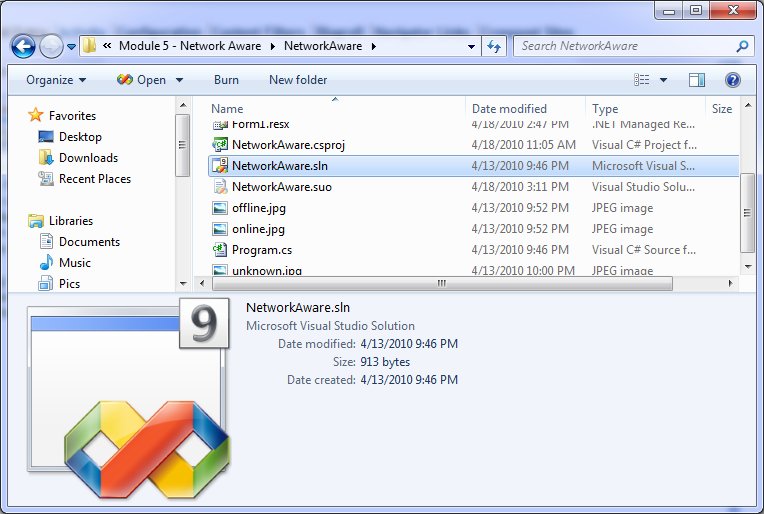 OK,so VC8 means Visual C++ 2005? Basically. As long as you realize that it doesn't mean version 8 of the compiler. Because the C compiler transitioned into the C/C++ compiler, the version numbers came with it. VC8 includes version 14 of the compiler. Confused yet? If so, you're in good company. Here's a tabular explanation, though it only goes back a decade. You want more details? Wikipedia has them, of course. Me, I am going to enjoy Dev10 and watch for news of Dev11. Kate
As you probably know, we're on our way to a new version of the .NET Framework. There's so much that is new in it you could hardly know where to start. I'm just letting the information wash over me in other people's blogs, and trying things out with the beta from time to time. I spotted two related things in the last little while. First was Improvements to Interop Marshaling in V4: IL Stubs Everywhere on the CLR team blog. The takeaways here are faster performance, consistency between the 32 and 64 bit worlds, and better debugging. Since there is still a lot of native code hiding underneath your managed calls to library functions, everyone cares about the faster performance aspect. Read the post for all the details if interop matters to you the way it matters to me. Second was COM Interop Gets Much Better in C# 4.0 on DevX. I've always avoided C# for COM interop work because it doesn't do optional parameters, and most COM work is rich in them, especially working with Office, which I used to do quite a lot of. Less casting, no need for PIAs, no more fake values called "missing" or some variant thereof ... it's all good. And here again the magic words "improved performance". Two small things to note with a non-small impact on your life as a developer. Kate
Recently I came across an article suggesting how a good developer should comment their code. This was aimed at those writing SQL scripts, but that doesn't particularly matter. The rules were the same ones I lived by in the 70's and for a long time since then. For example, at the start of each file there should be a modification history, like this: /* Title: 002 - Setup SQLCMS.sql
Purpose: Setup the various components for SQL CMS
Version: 1.1
Modification History:
04/30/2009 - Buck Woody - Initial Script Creation
05/15/2009 - Buck Woody - Added MAPS load scripts
I copied Buck's since I don't have any like this myself kicking around. And why not? Because VSTS and TFS take care of that for me. Who changed it, what they changed, and why is all available in the repository. Duplicating it in the file itself just gives you another task to forget, and another pair of locations that might get out of sync. So I don't do these any more. There's another kind of comment that we all used in the 70's and 80's and that was the "explain your names" comment. When you only had 8 characters to work with, you needed a big block of comments that told everyone that NPPLINV was Number of People Invited and CIDMNEW was Calculate Interest, Daily Method, New or whatever. But we don't have name length restrictions any more. So why do I still see this sort of thing: Dim ClientName as String ' Variable to hold name of client
Dim ClientBirthDate as Date ' Variable to hold birth date of client
Dim ClientRepID as Integer ' Variable to hold ID of client rep
(Don't believe me? I saw this very code yesterday in a VB6 app I was debugging.) As Jon Torresdal points out, if you choose your function names and variables well, you don't even need those single lines that explain funky-looking calculations. Extract your weird stuff to a function, even if it's a single-line function, and it explains itself. You can see a similar approach, though comments are never mentioned, in Justin Etheredge's post about isolating logic into little functions. So let's see, no comments at the top to explain what the file is, no comments after each variable to explain its strange and abbreviated name, no comments before funky calculations because they've been refactored into single line functions ... well what comments even remain, then? Well there's commented-out code - but I have a rule against that. There's this sort of thing: 'only update confirmed date the first time it's confirmed
If DateConfirmed = Nothing OrElse DateConfirmed = New Date() Then
DateConfirmed = Today
End If Sometimes these comments are there because the developer wrote the comments first, as pseudo-code, then filled in the code. Other times they are just an attempt to translate the code into English for the reader. Does it help? Well, maybe. But comments are becoming less and less important as time goes by. Interesting.
Kate
I hate SharePoint sometimes. It's powerful, and strong, and free(ish) and does an amazing job. If you just want to install it and use it, there's really nothing to complain about. But it's greatest strength, and my greatest user-upper of swearwords, is that you can program against it. With each release, whatever I swore about last time is magically fixed (RunWithElevatedPrivileges FTW) but a whole pile of new misery sneaks in out of nowhere. (Well, and CAML remains, but I guess we can't do anything about that.) It's usually related to security, but not always, and the thing is that debugging it is always like surgery with oven mitts on. I had a situation where I wanted to find the item you just added. Took a little searching, but I found it: query.Query = "<Where><Eq><FieldRef Name='" & list.Fields.Item("Created By").InternalName & _ "'/><Value Type='User'>" & SPContext.Current.Web.CurrentUser.Name & "</Value></Eq></Where>" & _ "<OrderBy><FieldRef Name='Created' Ascending='FALSE' /></OrderBy>" items = list.GetItems(query) The first entry in items is the thing you most recently added. OK, fine. But we have event receivers on these lists, and they go off asynchronously. That means that right after you saved an item, while the receiver is still processing, the item isn't returned by the query. Well that made me grumpy but I understood, so I made a loop, and if the first entry in items wasn't recent enough (say, in the last two minutes) I would have a little sleep and then ask again. But no matter how long I waited (even 20 minutes!) this code never would find the item. Oh, there was swearing, you can be sure of that. I decided that SharePoint must be caching the query results. But searching for things like "SPListItemCollection cache" just got me helpful tips on caching these results myself, some thread safety issues, and the like. For example, this MSDN article says You might try to increase performance and memory usage by caching
SPListItemCollection objects that are returned from queries. In
general, this is a good practice; however, the
SPListItemCollection object contains an embedded
SPWeb object that is not thread safe and should not be cached.
Does that match up well with what I am seeing - always the identical results from this query-in-a-loop even though I know the underlying list has changed while the loop was running? It does not. Then I found two blog entries by Jeff Crossett: first the complaint, and then the solution. He's right. And when I implemented his hack: ' use a random value in query so we don't get cached.
randomValue = generator.Next(100, 1000000000)
query.Query = "<Where><And><Eq><FieldRef Name='" & list.Fields.Item("Created By").InternalName & _
"'/><Value Type='User'>" & SPContext.Current.Web.CurrentUser.Name & "</Value></Eq><Neq>" & _
"<FieldRef Name='Title' /><Value Type='Text'>" & randomValue.ToString & "</Value>" & _
"</Neq></And></Where>" & _
"<OrderBy><FieldRef Name='Created' Ascending='FALSE' /></OrderBy>"
items = list.GetItems(query) We all lived happily ever after. Well, until the next WTF that SharePoint throws my way. I am doing amazing things with this product. My customers would pay more for their software if SharePoint didn't exist. But man, sometimes it is HARD. Kate
Here's another tip from Habib on debugging. If you have a particular screen you want to bring up, and it takes a lot of clicking and selecting to bring it up, why not just set a breakpoint and then bring it up by constructing and calling it with the immediate window?
Habib's video features a WPF application, and the constructor takes no parameters, but you could use this for Windows Forms and you could pass through whatever parameters you needed to. A very handy tip - any language, any kind of client application.
It's been a while since I did a series of posts on debugging tips:
So here is not so much a tip as an announcement. You see , it's no coincidence that my examples for conditional breakpoints were numbers (some index into a structure is greater than 346, or Xid is 1234.) Until now, you couldn't really use strings in conditional breakpoint expressions. But the cool news is that, starting with Visual Studio 2010, you can!
You can't just call arbitrary functions including your own foo(whatever), but you can call a pretty impressive list of variants on strlen and strcmp. The details on are Habib Heydarian's blog. Just one more reason to want Visual Studio 2010!
Kate
So is there anything you hate more than the old "Unknown Error" when you're doing Sharepoint development? I found this tip on Madhur Ahuja's old blog (he moved it earlier this year) and it's short enough I can paste it here:
Find the web.config for the site you normally use as your development site. Locate this tag: <SafeMode ... CallStack="false"> and change it to CallStack="true".
Set <CUSTOMERRORS mode="On">to mode="Off".
Set <compilation debug="false" batch="false">to <compilation debug="true" batch="true">
Now you will get the full stack trace as soon as the error is raised.
Works like a charm! Well done Madhur, and thankyou!
Kate
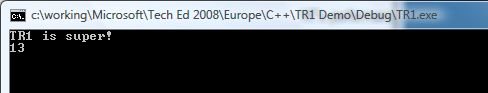
One of my demos (OK, more than one) for my upcoming Tech Ed Europe talks is a console application. I find when you're doing complicated concepts like C++ templated code, that adding the plumbing to talk to a Windows application (whether MFC, Windows Forms, WPF or whatever) can obscure what's going on. Generally speaking people can follow cout << i << endl; just fine and it reduces the header files and so on that are needed to use the sample.
I had one problem though - on this machine, when debugging a console application I couldn't get the Properties of the command prompt to come up when stopped at a breakpoint, and of course the command prompt disappears as soon as the program finishes running. I could change the properties in the command prompt you get for "start without debugging" but they had no effect on the debug one. The font was too tiny to use in a presentation:
Here's what I did. I brought up any old command prompt, right-clicked in the title bar, and chose Defaults instead of Properties. This affects every command prompt on your machine at once. I switched to Lucida Console and a bigger size, and closed the command prompt, then debugged my console application again:
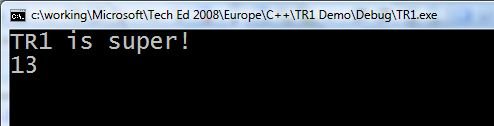
Do I care that the font is now big in all my other command prompts? Not really. I suppose if I did I could deal with their properties one by one.
Kate
Some schedules I have flagged with "must attend" in my calendar:
TL13 Microsoft Visual C++: 10 Is the New 6
Boris Jabes
Get more done. The next version of Visual C++ is all about improving developer productivity for large-scale applications. Learn about the IntelliSense and browsing experiences, changes to the project and build system, project-less browsing, collaboration through remote symbol indexing, and custom visualization of symbolic information.
Tags: Advanced, Languages
PC26 Microsoft Visual Studio: Building Applications with MFC
Damien Watkins
The next release of MFC will provide encapsulations around a number of new Windows platform features. With this functionality you can easily build applications that integrate into features such as desktop search, application restart and recovery functionality, leverage the new Windows UI metaphors such as Live Icons and Rich Preview. These features represent one of the most significant updates to MFC in years. Come learn the details on all these new classes so you can rapidly build Windows applications that stand out from the crowd.
Tags: Advanced, Visual Studio
TL25 Parallel Programming for C++ Developers in the Next Version of Microsoft Visual Studio
Rick Molloy
Build more responsive C++ programs that take full advantage of multicore hardware. We demonstrate how the new Parallel Pattern Library (PPL) enables you to express parallelism in your code and how the asynchronous messaging APIs can be used to separate shared state and increase your application's resilience and robustness. Finally, we take a look at some of the new capabilities of C++0x and Visual Studio to help you efficiently code and debug your multi-threaded applications.
Tags: Advanced, Parallelism, Visual Studio
Kate
Some time ago a prospect called me to ask if I could help him solve a really frustrating problem. He had some software that was working and that he had delivered to dozens of clients, but sometimes it froze. It featured a lot of timers and he thought the problem was that one of them stopped firing, but he wasn't really sure. Could I do a code review for him and find where he had been stupid or sloppy to cause this problem?
So this is an intriguing concurrency problem, because multiple overlapping timers are not something you can definitively test, so I answered him "sure, send me the code." He sent it along and unfortunately it was really quite well written. That's unfortunate because I couldn't point to some obviously sloppy or stupid code and say "fix this and all will be well." We gave him some advice about how to gather problem information from users when they reported that one of the clock/timers "froze", and wished him luck.
Months later he came back, saying that it was a distinguishable subset of his clients that were having the problem, and please could we look again? He sent us the source code, as well as a deploy package that had gone to the most recent client to experience the problem. At first, we couldn't build his source code, because he had a whole pile of custom controls and funny license files and so on. So while we were waiting for him to send us things, we played with the executable. We couldn't make it misbehave. If repro cases don't come easily I usually switch to reading the code and imagining what could cause what I'm seeing, but when that doesn't work I'm back to trying for a repro. We were hoping it was having some sort of leak - memory, handles, something like that - which was freezing or hanging it. Repeated perusals of the source code convinced us the timers were a red herring, leaving mystery leaks as our best guess.
Did you know you can get Task Manager to show you more than just memory and CPU usage for your applications? On the View menu, choose Select Columns:
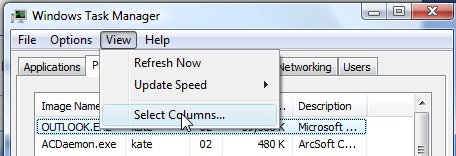
Then check off what you want, such as Handles and GDI Objects. Now watch while the application runs:
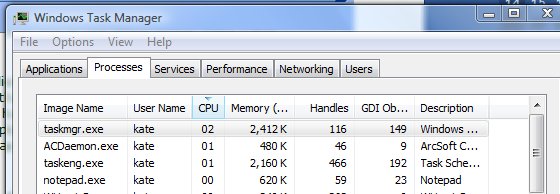
In this case, the deployed application didn't have a memory or handle leak, but it did seem to have a GDI Objects leak. The count kept going up, and never went down. We even discovered a way to make it go up -- there were buttons in the UI forming a toolbar of sorts, and they had a special effect as you moused over them and moused off again. Every time we caused the special effect to fire, the GDI Objects count would go up. This is the sort of thing that's impossible for developers to repro, because we don't idly wave our mouse back and forth along a toolbar wondering which button we should click. We test for like 5 minutes and say "looks ok to me." But we had been told that the freezes generally only happened when the application ran longer than usual - 4 hours rather than the usual 2 or 3. So we were hoping for some sort of leak that generally had no consequence, but could kill you if you waited long enough. So having learned how to drive the count up, we sat there waving the mouse around and driving it up. When we drove it past 10,000 - the application froze. Yay! Repro!
So we went into the source to reproduce it under the debugger - but the version we built from the source he sent didn't show the same behaviour - the GDI Objects count was well behaved and went up and down a little bit, never getting anywhere near 1,000 never mind 10,000. And interestingly, the source code he had sent us just used regular buttons in that toolbar like area. Aha! I blame the special button.
I asked him, since I didn't have the source for the version that was freezing, to tell me more about the button and where it came from. He told me the name and the URL from which it was downloaded. I went there and got a version number and file name, and confirmed he was running the most recent version available from that site. He also told me that now that I mentioned it, the only folks who'd reported freezing were the folks for whom he'd included the special button. So I knew it had to be the culprit. Time for some searching. Several people claimed that control had a "memory leak" problem. What's more, the developer of the control had released a newer version, which hadn't been mirrored over to the URL our guy found it from.
I told him all this, he went and got the newest version of the control, built the solution, and indeed the GDI count is now well behaved, and no-one has been able to make the application crash, freeze, or hang ever since. (I sat on this story for a few months to be sure.) So there you go, problem solved! I wouldn't have thought it was possible when we started. The moral for me is to use all the tools you have, and to use them fully. This problem was solved with Task Manager, an insistence on trying to reproduce the problem, and Live Search. Phew!
Kate
Imagine you have a bug that happens only in production. You connect to the production server and do a whole pile of exploring, and now you think you know what you need to tweak on your dev box to reproduce the problem and get started on fixing it. Or perhaps you are half way through figuring something out on your own machine and you need to hand over to another developer. Maybe you just want to switch to your laptop because you’re leaving the office. There are many reasons why you might want to copy breakpoints between computers. As you may know, they are kept in a .SUO file (Solution User Options I believe) in your solution folder.
But heavens above, do not try to copy that file from one machine to another! As John Robbins says:
The .SUO file is the bane of your existence. Nearly all the problems you encounter with Visual Studio are the result of a corrupt .SUO file. Sadly, it seems all it takes to corrupt the .SUO file is your heart beating. In other words, whenever you have Visual Studio crash, refuse to debug, or behave strangely it's the .SUO file's fault. Whenever anyone asks me about strange Visual Studio behavior, my instantaneous response is "Delete the .SUO!"
So John took care of this with his own add-in. You can save a set of breakpoints into a little file. You can then move the file between machines and use it to set all those same breakpoints on another machine. Or, probably even more fun, you can set aside the 20-some breakpoints, tracepoints, conditionals and so on that you painstakingly set up for bug A, save them and then clear them all, set different ones for the drop-everything-urgent bug B, and then when B is fixed you can get all your old breakpoints back and return to working on A. John is giving the add-in away, it works for both native and managed code, so go on, get it now.
Kate
One of the questions I got in the booth at Tech Ed was about First Chance Exceptions. The attendee was getting these messages in the output window in Visual C++ warning about "first chance exception" and was concerned about it. A long-long-neglected neuron fired. I think I ran an article in a journal I edited 10 or so years ago in which Mike Blaszczak covered this. And I think the bottom line was "don't worry." So I ran a quick search and found this knowledge base article that indeed says "don't worry." The debugger gets the exception first, before your code. It just writes to the screen that it got it. Then your code handles the exception and life goes on as before. If your code doesn't handle the exception, then the debugger gets it again, and then perhaps something interesting happens. But first chance exceptions are nothing.
Having a long memory for tiny details is handy sometimes.
Kate
I've been talking with attendees already and thought I would share some ideas I've been passing along. Planning is key to getting the most out of this week. The last thing you want is to be wandering the endless halls of a huge convention centre wondering where you should go next.
Start by planning your sessions with the schedule builder. You should put at least two sessions into almost every slot. Here's why: some of the sessions you plan to go to will not be right for you. They will be too introductory, or too advanced. They will cover just one little part of a technology that you don't know enough about, or a giant overview when you've already decided to concentrate on one corner. This should be clear about 5 minutes into the talk, and then what you need to do is leave. The slides will be on CommNet or the attendee DVDs, so you can get your overview or introduction later. But this hour of your life spent in the same room with someone who knows the topic needs to be spent carefully. So you quietly leave, and head to the other session you planned for this time slot. There really isn't time for you to start flipping through the catalog for possibilities once you've already ducked out. On the other hand, if the session you chose is amazingly great, stay, and plan to get the slides for the other talk instead.
As the week goes on, you'll learn the leveling codes. Every session has a code like TLA326 (my Tuesday afternoon talk.) TLA means Tools and Languages, which is appropriate since my talk is about MFC updates the team has just delivered. the "26" part doesn't really mean anything, it's just an identifier, but the 3 is the most important part of the session code. It means this is a 300 talk. These talks are advanced level, for experienced developers. They are supposed to include:
- Drilling into how a Product / Technology is designed
- Real world examples
- Complex coding, known issues and workarounds (sample code/examples)
Compare that to a 400 level talk (like my TLA403 late Friday.) These are expert level, and likely to have:
- Advanced coding considerations/challenges
- Design considerations/challenges
- Architecture considerations/challenges
- Troubleshooting techniques at the debug level
The best description I've heard is that a 400 level talk will make your head hurt, in a good way. But really you just have to start attending talks and then you will start to see the difference. You will also start to recognize key phrases in talk titles and abstracts such as A Lap Around and know what to expect from that session.
The next tip is that sooner or later you will have a timeslot with no sessions. Maybe you ducked out of one, and then ducked out of your second choice too. That's OK! Head down to the lowest level and wander by the product team booths in the TLC, or the Community Lounge, or do a Hands On Lab. These things are often the most important part of Tech Ed. More on that later!
Kate
If you want to get started in C++ development, or try some parts of it you haven't tried before (remote debugging, perhaps?) then you should take a look at these little video lessons on MSDN. They're adding more as they go, so keep an eye on it...
Kate
It's a strange thing about debugging under Vista that the one thing you really don't want to do is press F5. It's rather a long story as to why, but it's a good habit to go and find your executable and double-click it. And if you develop that habit, you may find that getting Visual Studio to build you a release or a debug version is not that simple. (Pressing F5 builds a debug version, and Ctrl-F5 builds a release version, before launching the application.) For many people, the dropdown that shows what configuration you're building has disappeared from the toolbar where it belongs. And even if you're brave enough to wade into the Customize dialog and put it back, it's disabled:
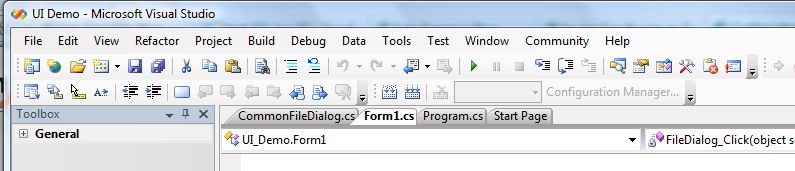
To get things back the way they once were, bring up Tools, Options, and go to the General section under Projects and Solutions. Find "Show advanced build configurations" and check it.
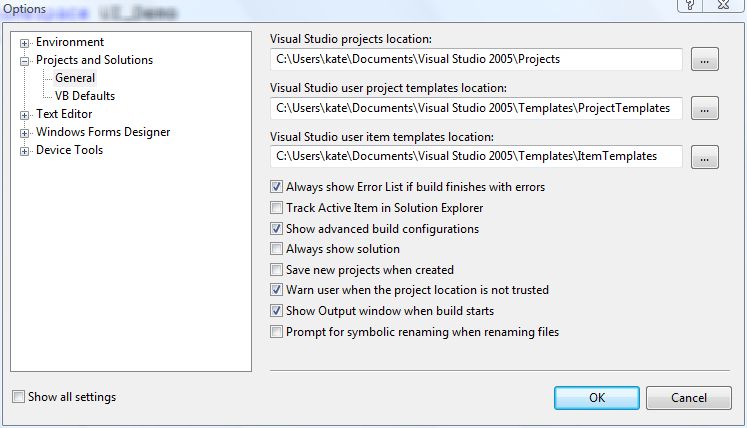
Presto! Debug is back!
Not what I'd call discoverable, so spread the word.
Kate
I once had an opportunity to write one of those Teach Yourself <Something complicated> in 21 Days books, or it might have been 24 Hours, or A Weekend, I forget. I was overloaded with work at the time and didn't write it. One of the things about writing those books is that nobody actually expects the reader to learn what they need in 21 days or 24 hours or whatever. It's basically the number of chapters. And if you processed one chapter a day, I guess you would cover the book in three weeks, but you wouldn't be a <Something complicated> programmer at the end of that, would you? Some folks might do 5 chapters a day, others might do a chapter a week. It depends on where you're starting from.
I came across a few interesting blog posts on this topic. Peter Norvig found hundreds of such books on programming languages or frameworks, and proposes instead Teach Yourself Programming in Ten Years. He has a point. Jasmine refines the point a bit, saying that if you're already a good developer you probably can pick up a new language or framework in a matter of days, and that if you don't have what it takes to be a good developer, ten years of plugging away at it won't make you good enough.
I've been getting paid to program since 1979, and I learn new things all the time. But I try to learn new languages no more than once a year -- and I wouldn't be able to invest 21 days in learning a language, either. More importantly, I've invested quite a lot of time and effort into spotting those who will be good developers some day, and trying to speed the process of making them better. I think the emphasis on debugging and on reading or fixing the code of others is appropriate. It's tempting to have the newbies work on little projects alone since they can't understand your big complicated project with difficult code written by the really smart people. But trying to understand that project and that code is what will make that newbie a developer -- or show you both that it's a hopeless cause .
Kate
Thottam R. Sriram has an article in the January MSDN Magazine called CLR Inside Out: Introduction to COM Interop. As the introduction says:
COM is a wonderful technology. One aspect of the common language runtime (CLR) that makes it an extremely powerful platform is that it allows seamless interactions between Microsoft® .NET applications and unmanaged COM components. However, when I searched the Web, I found few working samples demonstrating the very basic concepts of COM interop. The purpose of this column is to illustrate those basic concepts in order to provide solid working examples that can jump-start users in this technology.
I'll start off with a simple Active Template Library (ATL) COM server and try accessing methods in this server using an unmanaged COM client, then do the same thing with a managed client. I'll walk through the various DLLs to illustrate the translation from unmanaged to managed, and I'll show how to access an exported method in an unmanaged DLL using P/Invoke. The toughest part of this is to figure out marshaling of complex structures, which I don't cover exhaustively in this column-it would be a complete column (or book) on its own. I'll show you how unmanaged code can call back into managed code using interfaces. (You could do this with delegates as well, but I won't cover that in this column.)
Finally, I'll discuss debugging your COM interop project using public symbols. This will give you very basic introduction to WinDbg.exe, unmanaged debugging, and managed debugging using SOS. I'll demonstrate the stack from managed to unmanaged as calls are made in either direction.
The managed client is in C# -- when you write your clients in C++/CLI you don't have to figure out how to declare and marshal complex structures, after all. And seeing how to call back from native code to managed code is helpful indeed. I'm not sure if Reverse P/Invoke is the official name for this, but it works for me. You set up an interface in your C# code and decorate it with attributes for COM. Then you implement that interface in your code and use tlbexp to make a COM Callable Wrapper around your .NET object. Then you hand-define the same interface as a COM interface in your native code and you're all set. The .NET code can P/Invoke some native function and pass in a reference to the .NET interface. By the time it's unmarshaled over in the native world, it's become a smart pointer to that COM interface and you can invoke the method from the native code. It's a little tricky, but it's not hard - once you've seen it done.
Since the article wraps up by touching on Windbg, there's something for everyone. Check it out!
Kate
Data tips are really cool. It's fun to drill down into containers and complex objects and really see what's going on:
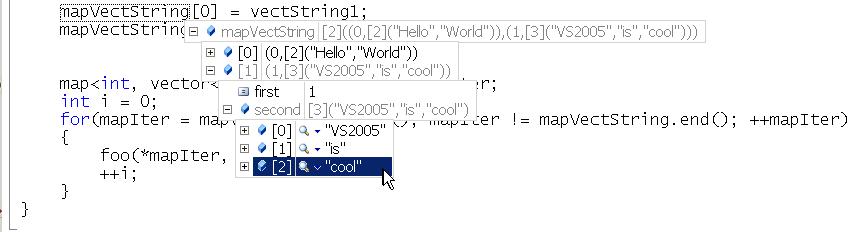
So imagine you're in the debugger. You've expanded all this stuff, and you really understand what's in mapVectString now. It has two entries, each is a vector of strings, and you're looking at entry #1 and it has three strings, and you have a good mental picture of the object. Nice. So when I'm debugging, my next step is to say to myself what the code is going to do, given what the object holds. I know most of us do that -- we solve the bug before control even reaches the bad line. But there's one problem... these delightful data tips are covering up the code!
Now, you could move your mouse off the tips, let them fade, read the code, and bring them back again, but that isn't exactly fun or efficient. So try this instead. Press Ctrl. Nothing else, just press Ctrl by itself.
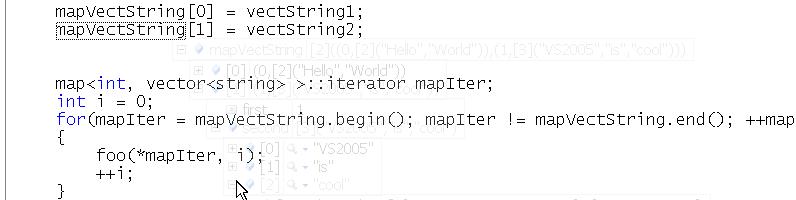
See that? the data tips go almost (but not completely) transparent. Let go of Ctrl and they come back! I bet the first time you try this you will press and release Ctrl a bunch of times with a silly grin on your face. I know I did. Enjoy! BTW, it appears to be Visual-Studio-wide so feel free to apply this tip to your VB and C# programming also.
Kate
One of the things I do for many of my clients is code review. This comes in two flavours. The first is where we all pile into a room with a projector and someone walks us through the code while we ask questions. Sometimes as a result of this the original author has to go away and rewrite bits of the code, but it's just as likely that the outcomes will be everyone understanding how something works, or knowing what there is in someone else's part of the application. The second is less interactive. I read over code and point out bad, dangerous, sloppy, or hard to maintain code. This might be hardcoded error messages in a multilingual application, or non parameterized dynamic SQL, or poor object orientation, or any one of hundreds of other things. Often I point it out not to the author of the code directly, but rather to the author's manager. Or in at least one case, their former manager. (As in, now that we got rid of this person, can you tell just how much mess he left behind?)
Now, if you are thinking of going to Team Systems, let me give you another reason to do so. It can automate a lot of these types of checks. For example, here's a really quite poor little class: Public Class Company
Private networth As Integer = 0
Public name As String
Private foundingdate As Date
Public Sub New()
End Sub
End Class
When I run static analysis against this, in no time flat it points out:
Running Code Analysis...
C:\Program Files\Microsoft Visual Studio 8\Team Tools\Static Analysis Tools\FxCop\FxCopCmd.exe /o:"bin\Debug\Information.dll.CodeAnalysisLog.xml" /f:"bin\Debug\Information.dll" /d:"C:\WINDOWS\Microsoft.NET\Framework\v2.0.50727" /r:C:\Program Files\Microsoft Visual Studio 8\Team Tools\Static Analysis Tools\FxCop\\rules
MSBUILD : warning : CA1020 : Microsoft.Design : Consider merging the types defined in 'Information' with another namespace.
MSBUILD : warning : CA2209 : Microsoft.Usage : No valid permission requests were found for assembly 'Information'. You should always specify the minimum security permissions using SecurityAction.RequestMinimum.
MSBUILD : warning : CA2210 : Microsoft.Design : Sign 'Information' with a strong name key.
MSBUILD : warning : CA1014 : Microsoft.Design : 'Information' should be marked with CLSCompliantAttribute and its value should be true.
C:\Documents and Settings\Administrator\My Documents\Visual Studio 2005\Projects\Information\Information\Class1.vb(6): warning : CA1805 : Microsoft.Performance : Company.New() initializes field networth of type System.Int32 to 0. Remove this initialization as it will be done automatically by the runtime.
MSBUILD : warning : CA1823 : Microsoft.Performance : It appears that field 'Company.foundingdate' is never used or is only ever assigned to. Use this field or remove it.
MSBUILD : warning : CA1051 : Microsoft.Design : Make 'name' private or internal (Friend in VB, public private in C++) and provide a public or protected property to access it.
MSBUILD : warning : CA1823 : Microsoft.Performance : It appears that field 'Company.networth' is never used or is only ever assigned to. Use this field or remove it.
Code Analysis Complete -- 0 error(s), 8 warning(s)
Done building project "Information.vbproj".
========== Build: 1 succeeded or up-to-date, 0 failed, 0 skipped ==========
Meaningless initializations, unused variables, public member variables... they get found. It's a great start.
Kate
How many Visual Studio Developers know about autoexp.dat? My guess is not many. This file, located in C:\Program Files\Microsoft Visual Studio 8\Common7\Packages\Debugger for a typical install, controls how the debugger shows values in the Data Tips, locals window, auto window, etc. The file is yours, it's on your own computer, and you're free to edit it. Here's how to do so for a really simple (and redundant) type, Point: class Point
{
private:
int x, y;
public:
Point (int xx, int yy)
{x=xx; y=yy;}
int getx()
{return x;}
int gety()
{return y;}
};
I ran a really simple app that constructed a point, and paused in the debugger for a data tip:
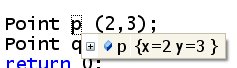
Then I edited autoexp.dat, adding this line:
Point =(<x>,<y>)
I saved it and ran the debugger again, and now the tip looks like this:
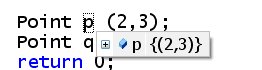
You can do this for any class you write. It's your program, you might as well make your debugging life easier.
Oh, if you're wondering why my data tips are actually readable instead of in some tiny 3 point font, I blogged that earlier this summer.
In October, Kathleen Dollard is coming to the East of Toronto UG! On October 19th, she'll be talking about Generics. Specifically:
Generics open up new opportunities to increase the robustness of your code, improve its performance, and significantly reduce the total amount of code you write. After a brief introduction to generic syntax, this talk dives into using generics to improve the quality of your code. You'll see how easy it is to shift your current collections to generic collections and learn about new features such as robust sorts, finds, and filters across collections. You'll learn how to write your own generic methods and classes. Finally you'll see how to leverage the spectrum of generic possibilities in a business object hierarchy that reduces the total lines of code by about 50%. You'll walk out of this talk understanding how to use generics to improve your own applications.
This meeting is at the YWCA Durham, so when you register, check the map and make sure you know where you're headed. If you haven't heard Kathleen speak before, you need to be there. Here's a little more about her:
Kathleen Dollard is a consultant, author, trainer, and speaker. She’s been a Microsoft MVP since 1998, wrote “Code Generation in Microsoft .NET” (Apress) and is a regular contributor to Visual Studio Magazine. She speaks at industry conferences such as VSLive, DevConnections, and Microsoft DevDays as well as local user groups. She’s the founder and principal of GenDotNet. Her passion is helping programmers be smarter in how they develop by learning to use Visual Studio, XML related technologies, .NET languages, code generation, unit testing, and other tools to their full capacity. She’s currently working on full life cycle improvements, such as better debugging and capturing business intent in metadata and test definitions. When not working, she enjoys woodworking, snowshoeing, and kayaking depending on the outdoor temperature.
I'll be a little crazed that week getting ready to head to Africa, but I'll be there.
Kate
Conditional breakpoints are cool when you know the value of one variable that is associated with trouble: this only blows up when Xid is 1234. They can also be used to reduce the boredom of single stepping. Say you've got some loop that goes around a few hundred times building up some string or array or something. You don't want to keep going round and round and round... it would be nice to jump ahead to halfway through, for example, and see how things are looking. Now if this is a for loop with a handy named variable, say
for (int i = 0; i<1000; i++)
Then you can use a conditional breakpoint and say "stop when i is 200". Or you could be clever and stop when i % 200 is 0 -- so that's every 200 times. But what if there's no i? What if you're going through a file or a recordset/dataset/resultset and you're going until the end? You don't want to add some fake variable that gets incremented each time through the loop, just so you can set a breakpoint that breaks on certain values of that variable. Instead you want to use the hit count property of the breakpoint. Just right click the red dot and choose Hit Count. There you can set the breakpoint to break whenever it's hit, just the 10th time it's hit, every tenth time (10, 20, 30 etc) or every time after the 10th time Or, of course, whatever number you want instead of 10:
Don't debug the slow way when there are tools to make you so much faster!
Kate
Conditional breakpoints were another really important tool in solving a recent "only happens at the big installations" bug in a big and complicated C++ application. We wanted to debug the code with as few rebuilds as possible and we really didn't know how parts of it worked at all. Tracepoints helped us to figure out a lot of it in a short time. We didn't have a decent repro case though, so here's what we did:
- created a script to add an audit table and some triggers that write to it
- created a script to remove those triggers and the table
- created a batch file to run a server in verbose mode, and redirect the output to a text file (remembering DOS commands sure can be helpful... myapp.exe -verbose >logfile.txt was the magic phrase.)
- wrote some instructions for the support guy to grab a backup of the database, run the first script, run the batch file, let it run all night, then in the morning grab another backup of the database, run the second script, and stop the batch file.
Now we ran some queries on the morning version of the database to confirm that at least one X was missing a Y that should have been calculated overnight. We even had the Xid. Thanks to the tracepoint work of the previous day we knew where to be suspicious. A little digging in the trigger output told us whether the problem was "didn't get added" or "got added, but then got deleted". The last step was conditional breakpoints. These let us say "only stop here when you're processing the X with this Xid."
This really saves time when you just need to drill into what's happening in the case that is going wrong. You get to it by right clicking the red dot or diamond and choosing Condition.
Kate
The mentoring client I helped solve a big hairy bug using tracepoints does work in C# as well. She asked if tracepoints are available in C# and VB.NET too. They sure are!
As well, you can get to them other ways than just right clicking the red dot. There's a breakpoints window (reach it from the Debug menu: Debug, Windows, Breakpoints) that shows you what is set up for each of your breakpoints and tracepoints, and which you can use to enable, disable, delete, and edit breakpoints. You can also double-click a line in this window to go to that line of source:
I like to add that "Language" column when I'm working on a mixed project. Just click the Columns button and make your choices.
Kate
When you have a "mystery" bug to solve, tracepoints are a vital part of your debugging arsenal. Single stepping and looking through code can be S-L-O-O-O-O-W and if you don't even know what you're looking for, it can consume hours and hours of effort. Tracepoints really speed things up. They're like breakpoints that don't break. In a way, they go back to the old "printf debugging" -- but you don't need to make code changes and recompile to change them.
To set a tracepoint, first set a breakpoint, then right-click on the red dot that appears in the margin and choose When Hit:
In the dialog that appears, click the Print A Message box and edit the starter message you are given. You can include any expression in braces and it will be evaluated when control reaches the tracepoint:
Leave the Continue Execution box checked so that you don't break. Tracepoints are identified by red diamonds instead of red dots:
The output from the tracepoints appears in the output window of your debug session:
You can set up something suspicious, let it run, then pore through the tracepoint output and see what you learn. It's a huge timesaver when you're tackling a "we don't even know where to start" bug. Plus, if the issue is related to threading or async issues in any way (and you know me, I keep preaching we will all be facing async issues eventually) then you don't have to worry that pausing execution suppresses the collisions. I recently helped a client solve a big hairy this-stuff-fails-for-our-biggest-customer-only bug using tracepoints... and a few other tricks I will cover in upcoming posts.
Try it!
I have an HUGELY busy week planned at TechEd. It kicks off with meetings of MVPs and RDs (I have to miss the meeting of user group leaders, everyone had the same "day before TechEd starts" plan) and the keynote Sunday night. My talks are Monday (DEV309 Visual C++: IDE Features for Visual Studio 2005, 5:00 PM - 6:15 PM Room 259 AB) and Friday (DEV444 Visual C++: Debugging and Resolving Loader Lock and Side-by-Side Issues, 1:00 PM - 2:15 PM Room 160 ABC), and I won't miss the Women In Technology luncheon on Wednesday. In between I have so many meetings scheduled, it's a good thing the sessions will be on DVD afterwards because I just won't be able to attend all the ones I want to. And as for Boston tourism... well at least I'll see Fenway
If you're going to be there, drop me a note and let's see if we can have some "face time" of our own.
Kate
People regularly email me, or approach me at conferences, and ask me to “confirm” that Microsoft is trying to get rid of C++ in favour of C#. Since nothing could be further from the truth, I am not the person to get a confirmation from. But then again, I don't work for Microsoft, so maybe I'm deluded? That's why I like to find simple and unequivocal statements from people who do work for Microsoft, like this:
Visual Studio 2005 takes C++ development to a new level. For example, developers will get the same drag-and-drop experience creation of user interface as other languages, the same automatic statement completion and the same intuitive graphical debugger. Visual C++ 2005 developers will be able to build high performance 32-bit native code applications, use web services to interact with popular sites such as Amazon.com and Ebay, add professional quality 3D/2D graphics, video and sound using the DirectX SDK, all while generating robust and extremely fast code using our world-class C/C++ compiler.
C++ is here to stay for a long time and we are committed to providing the best tools for C++ development.
That's kind of hard to misinterpret. And when the Corporate Vice President of the Developer Division says it, you really need to believe it.
Here's a strange thing that happened yesterday. An ASP.NET app, written in VB.NET, was only intermittently dealing with its events, such as button clicks. At first it seemed to be that the event was handled if we were debugging, and not handled if we were not. But that turned out not to be the case.
Whenever you're faced with weirdness -- and let's face it, an event that sometimes is handled and sometimes is skipped counts as weirdness -- the knowledge base is your friend. A team member found 314965, which is a C# version of the problem. Although no-one could find a VB KB article, these are our symptoms, and more importantly this fix was a fix.
SYMPTOMS
A control event on a Microsoft Visual C# .NET Web application form may not fire. The event does not fire if you wire the control event imperatively, that is, if you double-click the event from the Events view and then add the code.
RESOLUTION
Add the event to the HTML code behind the form, that is, wire the control event declaratively.
“Wire the control event declaratively” means put an onxxx= attribute in the HTML:
<asp:Button id="Button1" runat="server" oninit="Button1_Init" Text="Button1"></asp:Button>
Instead of oninit you might have onclick or whatever event you have an issue with. Also, make your handler function public rather than private.
Moral of the story: there are two. First, it isn't always you. I can't tell you how many emails I've received telling me “there must be a bug in Microsoft's C++ optimizer, because my debug builds work beautifully but my release builds blow up.” Experienced C++ programmers mutter or shout “memory problem” when we get such emails: you're overwriting something or leaking or just generally not handling memory well; debug and release builds have huge differences in allocation, initialization, and other memory work when you're using unmanaged C++. Most of the time, it's you. But every once in a while, it's not you. And a quick search through the knowledge base is one way to see if it's you or not. Second, just because you're writing in VB doesn't mean that C# KB articles don't apply to you. Never be a language snob.
Kate
ps: of course I program in VB sometimes. What else would I use to create ASP.NET apps?
© Copyright 2026 Kate Gregory
Theme design by Bryan Bell
newtelligence dasBlog 2.3.9074.18820 ") ") | Page rendered at Saturday, 27 June 2026 16:27:22 (Eastern Daylight Time, UTC-04:00)
|
On this page....
| | Sun | Mon | Tue | Wed | Thu | Fri | Sat |
|---|
| 31 | 1 | 2 | 3 | 4 | 5 | 6 | | 7 | 8 | 9 | 10 | 11 | 12 | 13 | | 14 | 15 | 16 | 17 | 18 | 19 | 20 | | 21 | 22 | 23 | 24 | 25 | 26 | 27 | | 28 | 29 | 30 | 1 | 2 | 3 | 4 | | 5 | 6 | 7 | 8 | 9 | 10 | 11 |
Search
Navigation
Categories
Blogroll
Sign In
|